

HOT TOPICS LIST
- MACD
- Fibonacci
- RSI
- Gann
- ADXR
- Stochastics
- Volume
- Triangles
- Futures
- Cycles
- Volatility
- ZIGZAG
- MESA
- Retracement
- Aroon
INDICATORS LIST
LIST OF TOPICS
PRINT THIS ARTICLE
by Arthur Hill
IBM has been lagging the market over the last few weeks, and the current advance looks like a bearish rising wedge.
Position: Hold
Arthur Hill
Arthur Hill is currently editor of TDTrader.com, a website specializing in trading strategies, sector/industry specific breadth stats and overall technical analysis. He passed the Society of Technical Analysts (STA London) diploma exam with distinction is a Certified Financial Technician (CFTe). Prior to TD Trader, he was the Chief Technical Analyst for Stockcharts.com and the main contributor to the ChartSchool.
PRINT THIS ARTICLE
PRICE OSCILLATOR
IBM Looks Vulnerable
04/20/07 08:15:07 AMby Arthur Hill
IBM has been lagging the market over the last few weeks, and the current advance looks like a bearish rising wedge.
Position: Hold
| While the Standard & Poor's 500 moved to a multiyear high and the Dow Jones Industrial Average (DJIA) hit an all-time high this week, IBM remained well below its January–February 2007 highs, and this shows relative weakness. The stock is a key component of the S&P 500 and the DJIA but did not keep up with either, and this underperformance is a clear negative. |
|
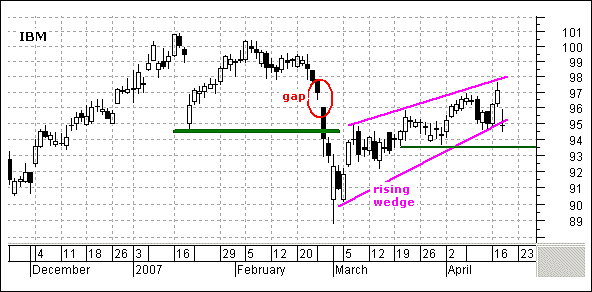
| FIGURE 1: IBM, DAILY. This stock broke key support with a gap and sharp decline in February. The stock bottomed a few days later. |
| Graphic provided by: MetaStock. |
| |
| Despite relative weakness, the stock has continued to trend higher since early March. IBM broke key support with a gap and sharp decline in February (Figure 1). The stock bottomed a few days later and worked its way higher over the next seven weeks. The advance traced out a rising wedge, and these are typical for countertrend rallies. IBM gapped down on April 18 and now looks vulnerable to further weakness. A break below the lower trendline and support at 93.5 would signal a continuation lower and target a move below the late February low. |
|
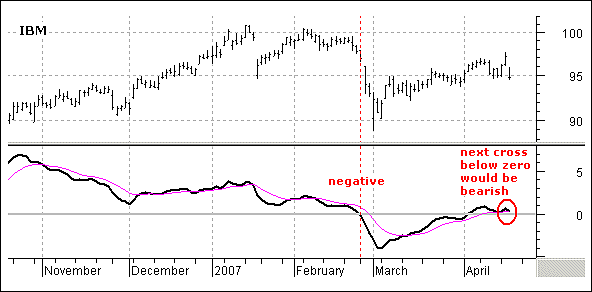
| FIGURE 2: IBM, MONTHLY. The price oscillator turned negative the day before the big decline in late February and bottomed out in early march. |
| Graphic provided by: MetaStock. |
| |
| Momentum was not strong on this rally, and the price oscillator is on the verge of turning negative again. This indicator is like the moving average convergence/divergence (MACD), but it uses percentages instead of absolute levels. While the MACD simply subtracts the five-day exponential moving average (EMA) (shorter) from the 35-day EMA (longer), the price oscillator measures the percentage difference. The five-day EMA is x% above or below the 35-day EMA. The indicator is positive when the five-day is above the 35-day and negative when the five-day is below the 35-day. |
| The indicator turned negative the day before the big decline in late February and bottomed out in early March (Figure 2). The price oscillator worked its way back into positive territory in early April and stalled just below +1%. The indicator is barely positive, and the bulls still have the edge as long as it holds in positive territory. A move below the zero line would turn the price oscillator negative, and this would be bearish for momentum. Such a move could be used to confirm a support break in the stock. |
Arthur Hill is currently editor of TDTrader.com, a website specializing in trading strategies, sector/industry specific breadth stats and overall technical analysis. He passed the Society of Technical Analysts (STA London) diploma exam with distinction is a Certified Financial Technician (CFTe). Prior to TD Trader, he was the Chief Technical Analyst for Stockcharts.com and the main contributor to the ChartSchool.
| Title: | Editor |
| Company: | TDTrader.com |
| Address: | Willem Geetsstraat 17 |
| Mechelen, B2800 | |
| Phone # for sales: | 3215345465 |
| Website: | www.tdtrader.com |
| E-mail address: | arthurh@tdtrader.com |
Traders' Resource Links | |
| TDTrader.com has not added any product or service information to TRADERS' RESOURCE. | |
Click here for more information about our publications!
Comments
Date:�04/20/07Rank:�4Comment:�

Request Information From Our Sponsors
- StockCharts.com, Inc.
- Candle Patterns
- Candlestick Charting Explained
- Intermarket Technical Analysis
- John Murphy on Chart Analysis
- John Murphy's Chart Pattern Recognition
- John Murphy's Market Message
- MurphyExplainsMarketAnalysis-Intermarket Analysis
- MurphyExplainsMarketAnalysis-Visual Analysis
- StockCharts.com
- Technical Analysis of the Financial Markets
- The Visual Investor
- VectorVest, Inc.
- Executive Premier Workshop
- One-Day Options Course
- OptionsPro
- Retirement Income Workshop
- Sure-Fire Trading Systems (VectorVest, Inc.)
- Trading as a Business Workshop
- VectorVest 7 EOD
- VectorVest 7 RealTime/IntraDay
- VectorVest AutoTester
- VectorVest Educational Services
- VectorVest OnLine
- VectorVest Options Analyzer
- VectorVest ProGraphics v6.0
- VectorVest ProTrader 7
- VectorVest RealTime Derby Tool
- VectorVest Simulator
- VectorVest Variator
- VectorVest Watchdog