HOT TOPICS LIST
- MACD
- Fibonacci
- RSI
- Gann
- ADXR
- Stochastics
- Volume
- Triangles
- Futures
- Cycles
- Volatility
- ZIGZAG
- MESA
- Retracement
- Aroon
INDICATORS LIST
LIST OF TOPICS
PRINT THIS ARTICLE
by David Penn
As the US dollar continues its slow-motion, spontaneous combustion before our very eyes, an important test against the Swiss franc looms.
Position: N/A
David Penn
Technical Writer for Technical Analysis of STOCKS & COMMODITIES magazine, Working-Money.com, and Traders.com Advantage.
PRINT THIS ARTICLE
REVERSAL
2B Test Of Bottom In The US Dollar-Swiss Franc
04/18/07 03:41:49 PMby David Penn
As the US dollar continues its slow-motion, spontaneous combustion before our very eyes, an important test against the Swiss franc looms.
Position: N/A
| My last two Traders.com Advantage takes on the foreign exchange market examined the possibility of reversal in two major currency pairs: the EUR/USD and the USD/CAD ("A 2B Top In The Euro?" from March 27, 2007, and "Bear Hunting In The Canadian Currency" from April 16, 2007). The former case was an example of a 2B top at work and the latter looked to positive divergences as a signal that a reversal was possible. |

|
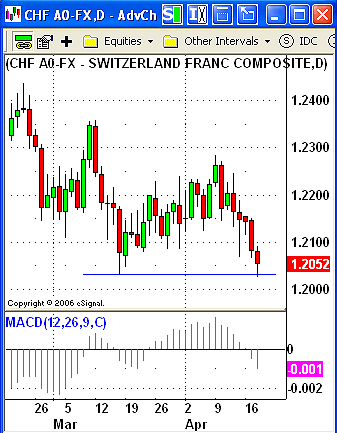
| FIGURE 1: US DOLLAR/SWISS FRANC, DAILY. An April retest of the March 2007 lows provides an opportunity for the US dollar to gain on the Swiss franc if the USD/CHF failed to show significant follow-through to the downside. The USD/CHF would then need to rally above the high of the initial low — to approximately the 1.2175 level — for the USD/CHF to be considered having truly reversed. |
| Graphic provided by: eSignal. |
| |
| Once again I am looking to the 2B test as the potential harbinger of a reversal, this time in the case of the bear market in the USD/CHF. The current leg down in this currency pair began in late January 2007 after the market topped out near 1.2575. This down leg hit a bottom in mid-March and then bounced over the balance of the month and into April. The market, as shown in Figure 1, topped out in the first half of April and began moving down again through mid-month, taking out the March low on an intraday basis. |
| This most recent move down finds the USD/CHF testing the March lows for support. While this is not make-or-break territory for the USD/CHF — the December 2006 lows near 1.1900 wait to provide another opportunity for support for the falling USD/CHF — there is precious little by way of support between the USD/CHF's current level and those December 2006 lows. This suggests that should support at the March 2006 lows not hold, a reunion with the December lows nearly 140 pips further down is possible. |

|
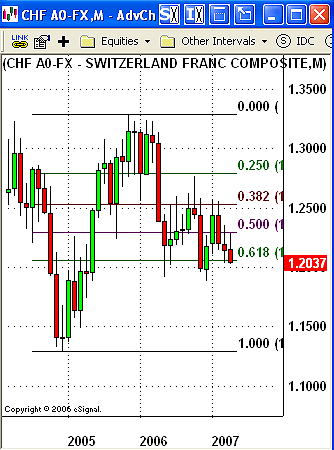
| FIGURE 2: US DOLLAR/SWISS FRANC, MONTHLY. It take a monthly view on charts this small, but with this view it is clear to see that the 61.8% retracement level has provided support for the falling USD/CHF on at least two separate occasions during the lows of 2006. |
| Graphic provided by: eSignal. |
| |
| Figure 2, a longer-term monthly look at the USD/CHF, shows both the 61.8% Fibonacci retracement level that has on two previous occasions provided support in the wake of the top in late 2005. This chart also reveals the downside available to USD/CHF should this retracement level — and the 2B test of bottom seen in the shorter-term chart from Figure 1 — do not hold. |
| What would be required for a successful 2B test of bottom? Not only would the USD/CHF need to show little or no follow-through to the downside beyond current levels (which approximate the March 2006 lows), but also the USD/CHF would need to bounce up above the high of the session that marked the initial March 2006 lows. That level is approximately 1.2175, some 150-odd points higher. Short of accomplishing this feat, the trend in the USD/CHF remains downward and a bet against the pair still more reasonable at this point than a wager in favor. |
Technical Writer for Technical Analysis of STOCKS & COMMODITIES magazine, Working-Money.com, and Traders.com Advantage.
| Title: | Technical Writer |
| Company: | Technical Analysis, Inc. |
| Address: | 4757 California Avenue SW |
| Seattle, WA 98116 | |
| Phone # for sales: | 206 938 0570 |
| Fax: | 206 938 1307 |
| Website: | www.Traders.com |
| E-mail address: | DPenn@traders.com |
Traders' Resource Links | |
| Charting the Stock Market: The Wyckoff Method -- Books | |
| Working-Money.com -- Online Trading Services | |
| Traders.com Advantage -- Online Trading Services | |
| Technical Analysis of Stocks & Commodities -- Publications and Newsletters | |
| Working Money, at Working-Money.com -- Publications and Newsletters | |
| Traders.com Advantage -- Publications and Newsletters | |
| Professional Traders Starter Kit -- Software | |
Click here for more information about our publications!
Comments
Date: 04/19/07Rank: 2Comment:

Request Information From Our Sponsors
- StockCharts.com, Inc.
- Candle Patterns
- Candlestick Charting Explained
- Intermarket Technical Analysis
- John Murphy on Chart Analysis
- John Murphy's Chart Pattern Recognition
- John Murphy's Market Message
- MurphyExplainsMarketAnalysis-Intermarket Analysis
- MurphyExplainsMarketAnalysis-Visual Analysis
- StockCharts.com
- Technical Analysis of the Financial Markets
- The Visual Investor
- VectorVest, Inc.
- Executive Premier Workshop
- One-Day Options Course
- OptionsPro
- Retirement Income Workshop
- Sure-Fire Trading Systems (VectorVest, Inc.)
- Trading as a Business Workshop
- VectorVest 7 EOD
- VectorVest 7 RealTime/IntraDay
- VectorVest AutoTester
- VectorVest Educational Services
- VectorVest OnLine
- VectorVest Options Analyzer
- VectorVest ProGraphics v6.0
- VectorVest ProTrader 7
- VectorVest RealTime Derby Tool
- VectorVest Simulator
- VectorVest Variator
- VectorVest Watchdog
