HOT TOPICS LIST
- MACD
- Fibonacci
- RSI
- Gann
- ADXR
- Stochastics
- Volume
- Triangles
- Futures
- Cycles
- Volatility
- ZIGZAG
- MESA
- Retracement
- Aroon
INDICATORS LIST
LIST OF TOPICS
PRINT THIS ARTICLE
by Arthur Hill
The NASDAQ has been moving higher since mid-March, and the latest gap affirms this uptrend — provided it holds and does not turn into an exhaustion gap.
Position: Hold
Arthur Hill
Arthur Hill is currently editor of TDTrader.com, a website specializing in trading strategies, sector/industry specific breadth stats and overall technical analysis. He passed the Society of Technical Analysts (STA London) diploma exam with distinction is a Certified Financial Technician (CFTe). Prior to TD Trader, he was the Chief Technical Analyst for Stockcharts.com and the main contributor to the ChartSchool.
PRINT THIS ARTICLE
GAPS
Mind The NASDAQ Gap
04/19/07 08:10:59 AMby Arthur Hill
The NASDAQ has been moving higher since mid-March, and the latest gap affirms this uptrend — provided it holds and does not turn into an exhaustion gap.
Position: Hold
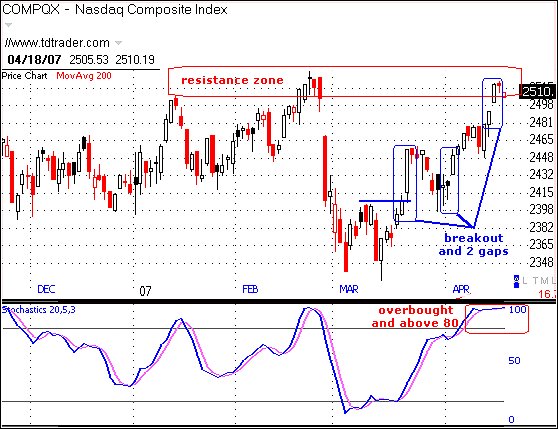
| The recovery is quite remarkable. The NASDAQ declined sharply in February 2007 with a gap and a long black candlestick (Figure 1). The move extended into early March, but the index soon found support and recovered all of its losses over the past six weeks. The recovery rally features a resistance breakout on March 21, a gap in early April, and a gap this week. The most recent surge above 2500 puts the index back in the resistance zone from the January–February highs, and a breakout here would show some serious strength. |

|
| FIGURE 1: NASDAQ. The most recent surge above 2500 puts the index back in the resistance zone from the January–February highs, and a breakout here would show some serious strength. |
| Graphic provided by: Telechart 2007. |
| |
| However, resistance has yet to be broken and the index is becoming overbought. The NASDAQ was turned back around 2500 in mid-January and late February. The third attempt shows resilience, but it ain't broken yet. For overbought evidence, the stochastic oscillator moved above 80 and remains at lofty levels. This indicator is both overbought and still bullish; look for a move back below 80 to show some weakness. And finally, the index is up over 6% in less than six weeks. The NASDAQ would be up 52% if this rate kept up for a year. This kind of pace shows strength, but it is hardly sustainable. |

|
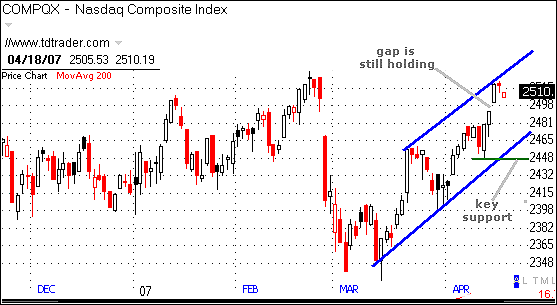
| FIGURE 2: NASDAQ. Further weakness below the March trendline and key support at 2450 would reverse the six-week uptrend and reinforce the resistance zone. |
| Graphic provided by: Telechart 2007. |
| |
| Despite resistance and overbought conditions, the six-week trend remains up and the most recent gap is holding. I am watching three items for a trend change: the April 16th gap, the March trendline, and the April 11th low. A close below 2490 would fill the gap and make it an exhaustion gap, which would be quite negative. Further weakness below the March trendline and key support at 2450 would reverse the six-week uptrend and reinforce the resistance zone (Figure 2). This would spell trouble for the NASDAQ, and I would then expect a support test around 2350. |
Arthur Hill is currently editor of TDTrader.com, a website specializing in trading strategies, sector/industry specific breadth stats and overall technical analysis. He passed the Society of Technical Analysts (STA London) diploma exam with distinction is a Certified Financial Technician (CFTe). Prior to TD Trader, he was the Chief Technical Analyst for Stockcharts.com and the main contributor to the ChartSchool.
| Title: | Editor |
| Company: | TDTrader.com |
| Address: | Willem Geetsstraat 17 |
| Mechelen, B2800 | |
| Phone # for sales: | 3215345465 |
| Website: | www.tdtrader.com |
| E-mail address: | arthurh@tdtrader.com |
Traders' Resource Links | |
| TDTrader.com has not added any product or service information to TRADERS' RESOURCE. | |
Click here for more information about our publications!
Comments
Date: 04/19/07Rank: 4Comment:

|

Request Information From Our Sponsors
- StockCharts.com, Inc.
- Candle Patterns
- Candlestick Charting Explained
- Intermarket Technical Analysis
- John Murphy on Chart Analysis
- John Murphy's Chart Pattern Recognition
- John Murphy's Market Message
- MurphyExplainsMarketAnalysis-Intermarket Analysis
- MurphyExplainsMarketAnalysis-Visual Analysis
- StockCharts.com
- Technical Analysis of the Financial Markets
- The Visual Investor
- VectorVest, Inc.
- Executive Premier Workshop
- One-Day Options Course
- OptionsPro
- Retirement Income Workshop
- Sure-Fire Trading Systems (VectorVest, Inc.)
- Trading as a Business Workshop
- VectorVest 7 EOD
- VectorVest 7 RealTime/IntraDay
- VectorVest AutoTester
- VectorVest Educational Services
- VectorVest OnLine
- VectorVest Options Analyzer
- VectorVest ProGraphics v6.0
- VectorVest ProTrader 7
- VectorVest RealTime Derby Tool
- VectorVest Simulator
- VectorVest Variator
- VectorVest Watchdog
