HOT TOPICS LIST
- MACD
- Fibonacci
- RSI
- Gann
- ADXR
- Stochastics
- Volume
- Triangles
- Futures
- Cycles
- Volatility
- ZIGZAG
- MESA
- Retracement
- Aroon
INDICATORS LIST
LIST OF TOPICS
PRINT THIS ARTICLE
by Chaitali Mohile
After correcting, Center Financial Corp. stops on its reliable supports.
Position: N/A
Chaitali Mohile
Active trader in the Indian stock markets since 2003 and a full-time writer. Trading is largely based upon technical analysis.
PRINT THIS ARTICLE
RETRACEMENT
CLFC Bottoming Out
04/19/07 01:01:05 PMby Chaitali Mohile
After correcting, Center Financial Corp. stops on its reliable supports.
Position: N/A
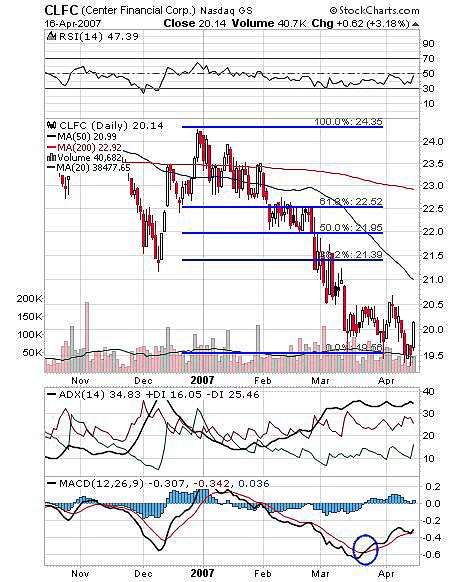
| Center Financial Corp. (CLFC) is currently correcting since the beginning of 2007. The moving average crossover in mid-December 2006 gave an advance warning of a bearish rally. With a high at $24.35, the price followed the direction of the moving average; CLFC lost around $5 in correction. The Fibonacci retracement in Figure 1 points to support levels that the stock held during the correction. At $19.50, the stock is at a crucial support level and seems to be consolidating with a range of $20.50-$19.50. Does this mean the stock is bottoming? Is the stock gearing itself up for a pullback rally? This retracement level holds due importance: If this correction gets diluted, a pullback can be expected. The 50-day moving average and the next prevailing retracement will be the next resistance level. |

|
| FIGURE 1: CLFC, DAILY. This stock appears to be bottoming at the lowest retracement level. Some pullback rally can be expected. |
| Graphic provided by: StockCharts.com. |
| |
| This wide correction made the moving average convergence/divergence (MACD)(12,26,9) travel below its zero line, giving a bearish indication. With price consolidating, the MACD gave a bullish crossover below its zero line. The MACD may give a buy signal if it remains positive and if it moves above its zero line. The average directional movement index (ADX)(14) shows a developing downtrend, but violating the retracement level and the moving average resistance indicate that more buyers' pressure is likely. This may change the future picture of the stock. The relative strength index (RSI)(14) has also tipped in the direction of the 50-day level, so this may add confidence in a pullback rally above the 38.2% retracement level. In addition, some healthy buying opportunity seems possible. |

|
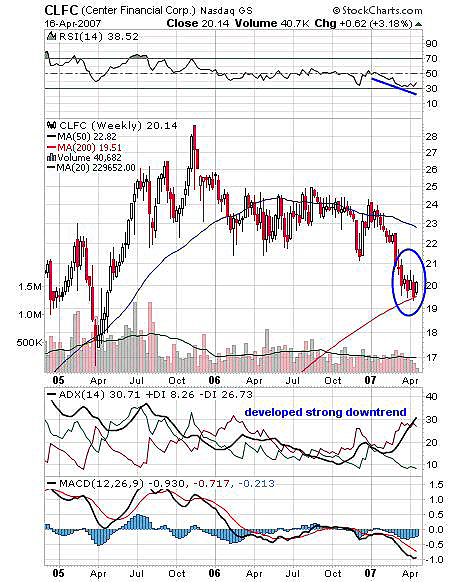
| FIGURE 2: CLFC, WEEKLY. This chart at the 200-day moving average provided crucial support to a bearish rally. |
| Graphic provided by: StockCharts.com. |
| |
| Figure 2, which shows the weekly chart, shows that CLFC failed to cross the 50-day moving average resistance, indicating poor strength in price movement. Resistance made the price fall to $19.50, but the 200-day MA support perked the stock up. The lowest retracement support in Figure 1 coincides with the 200-day MA support in Figure 2. In Figure 2, some price saturation can be seen at the same level. The downtrend as indicated by the ADX may continue till certain retracement levels in the daily chart and the 50-day moving average resistance in the weekly chart is taken off. |
| The RSI (14) established support at 30, though the price corrected. Though 30 is not at a positional level for the RSI, the possible bullish rally can be expected hereon. |
| Both Figures 1 and 2 thus suggest that CLFC is bottoming out at $19.50 and generating strength for a bullish rally. This pullback rally can be traded only above the 38.2% retracement level with targets of the next retracement level. |
Active trader in the Indian stock markets since 2003 and a full-time writer. Trading is largely based upon technical analysis.
| Company: | Independent |
| Address: | C1/3 Parth Indraprasth Towers. Vastrapur |
| Ahmedabad, Guj 380015 | |
| E-mail address: | chaitalimohile@yahoo.co.in |
Traders' Resource Links | |
| Independent has not added any product or service information to TRADERS' RESOURCE. | |
Click here for more information about our publications!
Comments
Date: 04/19/07Rank: 4Comment:

Request Information From Our Sponsors
- StockCharts.com, Inc.
- Candle Patterns
- Candlestick Charting Explained
- Intermarket Technical Analysis
- John Murphy on Chart Analysis
- John Murphy's Chart Pattern Recognition
- John Murphy's Market Message
- MurphyExplainsMarketAnalysis-Intermarket Analysis
- MurphyExplainsMarketAnalysis-Visual Analysis
- StockCharts.com
- Technical Analysis of the Financial Markets
- The Visual Investor
- VectorVest, Inc.
- Executive Premier Workshop
- One-Day Options Course
- OptionsPro
- Retirement Income Workshop
- Sure-Fire Trading Systems (VectorVest, Inc.)
- Trading as a Business Workshop
- VectorVest 7 EOD
- VectorVest 7 RealTime/IntraDay
- VectorVest AutoTester
- VectorVest Educational Services
- VectorVest OnLine
- VectorVest Options Analyzer
- VectorVest ProGraphics v6.0
- VectorVest ProTrader 7
- VectorVest RealTime Derby Tool
- VectorVest Simulator
- VectorVest Variator
- VectorVest Watchdog
