HOT TOPICS LIST
- MACD
- Fibonacci
- RSI
- Gann
- ADXR
- Stochastics
- Volume
- Triangles
- Futures
- Cycles
- Volatility
- ZIGZAG
- MESA
- Retracement
- Aroon
INDICATORS LIST
LIST OF TOPICS
PRINT THIS ARTICLE
by David Penn
Cardinal Health has been among the most consistent performers this year. But how many more new highs does Cardinal Health have left?
Position: N/A
David Penn
Technical Writer for Technical Analysis of STOCKS & COMMODITIES magazine, Working-Money.com, and Traders.com Advantage.
PRINT THIS ARTICLE
MONEY FLOW INDEX
Money Flow: Will Cardinal Health Catch Cold?
11/29/00 09:04:55 AMby David Penn
Cardinal Health has been among the most consistent performers this year. But how many more new highs does Cardinal Health have left?
Position: N/A
| What were your stocks doing in April? Yeah, that's what I thought. How about October? Hmmm, more of the same, it seems. If you had shares of Cardinal Health (NYSE: CAH), however, April and October might have meant little more than the fullness of spring and autumn, respectively. For while the major indices took significant hits in both of those months, shares of Cardinal Health advanced or, at a minimum, held ground en route to a 100% gain year-to-date. In fact, what makes Cardinal Health all the more impressive is the fact that, in addition to a 100% YTD gain, shares of Cardinal Health suffered few and relatively painless drawdowns (no more than 10%). In a year such as this, THAT is performance. |
| However, there are dark clouds on the horizon of Cardinal Health's apparently endlessly sunny days. While Cardinal Health's chart shows a stock making new 52-week highs as part of a rally from a two-month consolidation range, a number of indicators--money flow and relative strength, in particular--suggest that Cardinal Health's healthy streak might be coming to an end. |

|
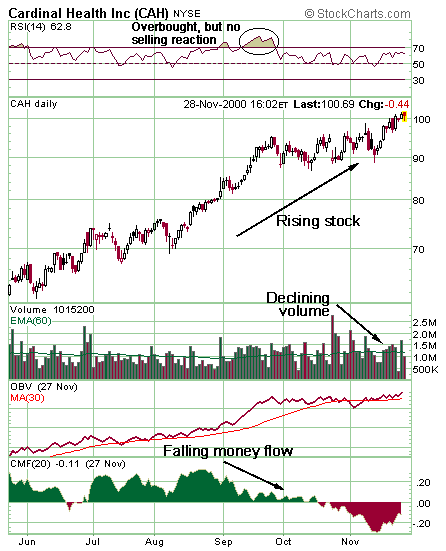
| Cardinal Health's year-long ascent was threatened by major negatives in money flow. But a rally in on-balance volume and flattening relative strength may help counter the bearish CMF. |
| Graphic provided by: StockCharts.com. |
| |
| Money poured into Cardinal Health in July and August, as shown by the mountain graph of the Chaiken Money Flow indicator (CMF). But in September, the flow of money abruptly taper off--so much so that, by late October, more money was moving out of Cardinal Health than was moving in. This change occurred during the October consolidation range mentioned above, as many of those who profited from CAH's rise from the high 60s and low 70s to the low to mid 90s took their money off the table. This trend in money flow, which was a mere trickle in October, became a raging torrent in November as more money left Cardinal Health. This November development peaked at mid-month, when shares of CAH threatened to close beneath 90. (The bottom of the October consolidation range was about 89.) |
| As Cardinal Health rallied back toward the top of its trading range and, in fact, broke out of the range to close above 100 and set a new 52-week high, the stampede of selling subsided somewhat--although, as the money flow indicator shows, Cardinal Health's money flow remained negative. On-balance volume, which had dipped beneath its 30-day moving average at the beginning of November, also began to rally slightly. The relative strength index has also stopped its slow descent, holding just below the overbought level at 70. |
| Given the distribution that appears to have taken place in October, as stronger sellers passed shares to weaker buyers, Cardinal Health's next move should be telling. While the consolidation area provides a base for further advances, these advances may be limited if the stock moved into primarily weak hands during October. Continued positive movement in on-balance volume, as well as money flow breaking out to the upside are perhaps the two most significant developments to watch for in December. Should investors and traders fleeing technology stocks attempt to find profit in other sectors, Cardinal Health could wind up as one of the chief beneficiaries of the Nasdaq bear. |
Technical Writer for Technical Analysis of STOCKS & COMMODITIES magazine, Working-Money.com, and Traders.com Advantage.
| Title: | Technical Writer |
| Company: | Technical Analysis, Inc. |
| Address: | 4757 California Avenue SW |
| Seattle, WA 98116 | |
| Phone # for sales: | 206 938 0570 |
| Fax: | 206 938 1307 |
| Website: | www.Traders.com |
| E-mail address: | DPenn@traders.com |
Traders' Resource Links | |
| Charting the Stock Market: The Wyckoff Method -- Books | |
| Working-Money.com -- Online Trading Services | |
| Traders.com Advantage -- Online Trading Services | |
| Technical Analysis of Stocks & Commodities -- Publications and Newsletters | |
| Working Money, at Working-Money.com -- Publications and Newsletters | |
| Traders.com Advantage -- Publications and Newsletters | |
| Professional Traders Starter Kit -- Software | |
Click here for more information about our publications!
Comments

Request Information From Our Sponsors
- StockCharts.com, Inc.
- Candle Patterns
- Candlestick Charting Explained
- Intermarket Technical Analysis
- John Murphy on Chart Analysis
- John Murphy's Chart Pattern Recognition
- John Murphy's Market Message
- MurphyExplainsMarketAnalysis-Intermarket Analysis
- MurphyExplainsMarketAnalysis-Visual Analysis
- StockCharts.com
- Technical Analysis of the Financial Markets
- The Visual Investor
- VectorVest, Inc.
- Executive Premier Workshop
- One-Day Options Course
- OptionsPro
- Retirement Income Workshop
- Sure-Fire Trading Systems (VectorVest, Inc.)
- Trading as a Business Workshop
- VectorVest 7 EOD
- VectorVest 7 RealTime/IntraDay
- VectorVest AutoTester
- VectorVest Educational Services
- VectorVest OnLine
- VectorVest Options Analyzer
- VectorVest ProGraphics v6.0
- VectorVest ProTrader 7
- VectorVest RealTime Derby Tool
- VectorVest Simulator
- VectorVest Variator
- VectorVest Watchdog
