HOT TOPICS LIST
- MACD
- Fibonacci
- RSI
- Gann
- ADXR
- Stochastics
- Volume
- Triangles
- Futures
- Cycles
- Volatility
- ZIGZAG
- MESA
- Retracement
- Aroon
INDICATORS LIST
LIST OF TOPICS
PRINT THIS ARTICLE
by Chaitali Mohile
International Game Tech plummeted, gapping down from its previous high at $48. A bearish moving average crossover further weakens the stock.
Position: N/A
Chaitali Mohile
Active trader in the Indian stock markets since 2003 and a full-time writer. Trading is largely based upon technical analysis.
PRINT THIS ARTICLE
MOVING AVERAGES
IGT Losing Strength
04/17/07 08:49:18 AMby Chaitali Mohile
International Game Tech plummeted, gapping down from its previous high at $48. A bearish moving average crossover further weakens the stock.
Position: N/A
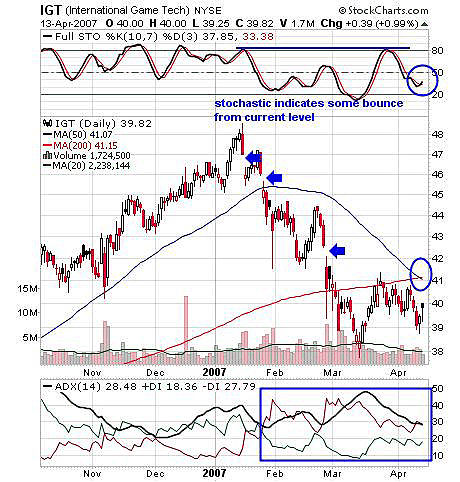
| International Game Tech (IGT) faced serious selling pressure on reaching a high of $48. IGT was unable to move above that level, hinting at a weakness in the rally. Figure 1, the daily chart, shows that IGT gapped down faster, losing almost $10 from its resistance line. The stock failed to hold its 200-day moving average support, correcting even more. The 50-day moving average is now moving toward a bearish crossover, and this may weaken the stock further. |

|
| FIGURE 1: IGT, DAILY. The price faces moving average resistance. |
| Graphic provided by: StockCharts.com. |
| |
| Along with the 200-day moving average resistance, Figure 1 also points to a stochastic (10,7,3) resistance at 80. The price faced moving average resistance and the stochastic also failed to move above 80. As a result, the price dipped to $39. |
| The stochastic moved to 33, indicating the possibility of a bounce back. The moving average resistance can obstruct this movement, and hence, traders should avoid any trade on this pullback. The average directional movement index (ADX)(14) shows that the downtrend has already developed, and so, the short side is stronger. |

|
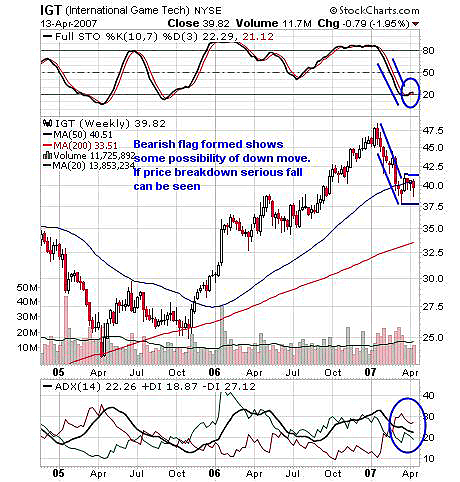
| FIGURE 2: IGT, WEEKLY. A bearish flag & pennant formation weakens the stock further. |
| Graphic provided by: StockCharts.com. |
| |
| In Figure 2, a chart of the weekly IGT has formed a bearish flag & pennant formation, and again the price is facing a 50-day moving average resistance, and more downside is expected. After falling $10, the price consolidated in the range of $37.50–$40, forming a flag. It could lose more if the stock breaks down from the flag & pennant formation. The stochastic (10,7,3) has marginally moved to 22, indicating some more consolidation, and so I am reluctant to give any target for a short trade below $37.50. But once the consolidation is completed, traders can calculate the target by measuring the length of the flagpole and subtracting it from the breakdown level. |
| Though more downside is expected in IGT, traders may choose to wait and watch till $37.50 is violated. |
Active trader in the Indian stock markets since 2003 and a full-time writer. Trading is largely based upon technical analysis.
| Company: | Independent |
| Address: | C1/3 Parth Indraprasth Towers. Vastrapur |
| Ahmedabad, Guj 380015 | |
| E-mail address: | chaitalimohile@yahoo.co.in |
Traders' Resource Links | |
| Independent has not added any product or service information to TRADERS' RESOURCE. | |
Click here for more information about our publications!
Comments
Date: 04/17/07Rank: 4Comment:

Request Information From Our Sponsors
- StockCharts.com, Inc.
- Candle Patterns
- Candlestick Charting Explained
- Intermarket Technical Analysis
- John Murphy on Chart Analysis
- John Murphy's Chart Pattern Recognition
- John Murphy's Market Message
- MurphyExplainsMarketAnalysis-Intermarket Analysis
- MurphyExplainsMarketAnalysis-Visual Analysis
- StockCharts.com
- Technical Analysis of the Financial Markets
- The Visual Investor
- VectorVest, Inc.
- Executive Premier Workshop
- One-Day Options Course
- OptionsPro
- Retirement Income Workshop
- Sure-Fire Trading Systems (VectorVest, Inc.)
- Trading as a Business Workshop
- VectorVest 7 EOD
- VectorVest 7 RealTime/IntraDay
- VectorVest AutoTester
- VectorVest Educational Services
- VectorVest OnLine
- VectorVest Options Analyzer
- VectorVest ProGraphics v6.0
- VectorVest ProTrader 7
- VectorVest RealTime Derby Tool
- VectorVest Simulator
- VectorVest Variator
- VectorVest Watchdog
