HOT TOPICS LIST
- MACD
- Fibonacci
- RSI
- Gann
- ADXR
- Stochastics
- Volume
- Triangles
- Futures
- Cycles
- Volatility
- ZIGZAG
- MESA
- Retracement
- Aroon
INDICATORS LIST
LIST OF TOPICS
PRINT THIS ARTICLE
by Paolo Pezzutti
The money flow and the on-balance volume indicate that investors are cautious about investing in tech stocks after the selloff at the end of February.
Position: N/A
Paolo Pezzutti
Author of the book "Trading the US Markets - A Comprehensive Guide to US Markets for International Traders and Investors" - Harriman House (July 2008)
PRINT THIS ARTICLE
MONEY FLOW INDEX
Tech Stocks And A Distribution Phase
04/16/07 01:42:33 PMby Paolo Pezzutti
The money flow and the on-balance volume indicate that investors are cautious about investing in tech stocks after the selloff at the end of February.
Position: N/A
| After the March selloff following the one-day market shakeup initiated by the Chinese market, I was expecting a continuation to the downside. Clearly, this has not occurred so far, as markets have recovered most of the losses. From the fundamentals perspective, the impact of the housing crisis on the US economy is not yet clear. Capital spending is getting lower, and with oil prices still high, the effect on the economy may be worse than expected. The US situation, however, is not having that much of a negative impact on the global economy, which continues to grow at a fast pace. How a trader should position him- or herself with respect to interest rates between the need to control inflation and a slowing economy is difficult to say, and a weak US dollar can generate inflation. A process has begun that will project new countries and areas as important actors on the global scene. The western countries will find benefits as new markets for consumers and infrastructure develop. However, current imbalances cannot find smooth solutions. Adjustments are usually fast and painful. We saw in May 2006 last year the first signs of what could happen, then again last month in March 2007. |
| Currently, buying the selloff has provided good returns in accordance with statistics of similar past events, but emerging markets represent the weak ring of the chain. They have overextended their gains; they are not mature and are therefore speculative. A change of risk assessment about these markets might generate high volatility. Technically, after the selloff, we have seen a recovery characterized by low volatility. Small daily ranges on up days, although an eight-day consecutive streak has been printed, indicate that the public is not putting fresh money into the market. Nonetheless, prices have gone up very close to the top. Could this be a distribution phase? Actually, it seems that the market does not have great potential to the upside. |

|
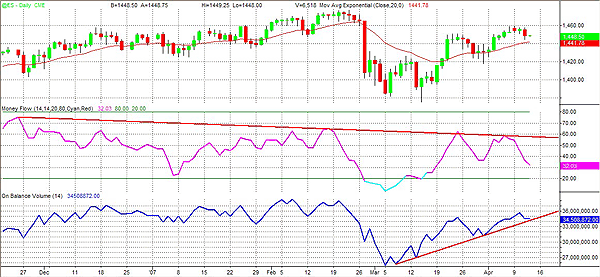
| FIGURE 1: EMINI S&P, DAILY. The money flow displays a negative divergence, which is not signaled by the OBV. |
| Graphic provided by: TradeStation. |
| |
| In Figure 1, you can see the emini S&P daily chart. I used the money flow indicator (pink) to assess the possibility of an ongoing distribution phase. The money flow is built around the "average price," which is calculated using the average of the open, close, high, and low of a bar. Positive money flow occurs when the current bar's average price exceeds the previous bar's average price. It is calculated by multiplying the current bar's volume and its average price. The positive money flows are then summed over a specified number of bars and divided by the sum of all the specified money flows. The formula is: Money flow = 100 * Sum of positive money flow / Sum of all money flow In the same chart I have inserted also the on-balance volume (OBV) (blue in the figure). The OBV distinguishes between up volume and down volume. When prices close lower one day than they closed the day before, the volume is considered down volume and assigned a negative value. When prices close higher than they closed the day before, the volume is considered up volume and assigned a positive value. OBV is a running total of down volume and up volume. In a healthy trend, the indicators track the price action. When a divergence between price action and the indicator occurs, it can be a signal that the market trend is about to change. At the daily level the money flow displays a short-term divergence in coincidence with the last pivot high. The OBV moved comfortably along a rising trendline. Overall, the S&P is not highlighting significant elements to assess that a distribution phase is ongoing. |

|
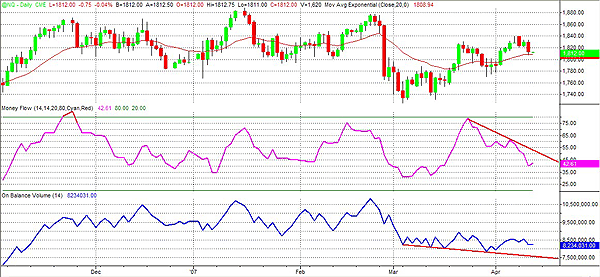
| FIGURE 2: EMINI NASDAQ, DAILY. Both indicators show negative divergences. Investors have been more prudent after the end of February selloff. |
| Graphic provided by: TradeStation. |
| |
| The situation is different in Figure 2, where you can see the emini NASDAQ. Here, both indicators show negative divergences developed during the last month. Investors after the selloff have been more prudent in putting their money into technology stocks. The long-range candle to the downside printed on February 27 indicated that prices would continue to move to the downside. However, the retracement has been significant, displaying that this market uptrend is very resilient. That is why, in summary, I would not expect excessive weakness, but rather a sideways move to develop from here with volatility more to the downside and a retest of the lows in the near future. In fact, for the moment I see the markets trapped to the upside by weak fundamentals with some concerns from emerging markets, which could open a negative longer-term phase. |
Author of the book "Trading the US Markets - A Comprehensive Guide to US Markets for International Traders and Investors" - Harriman House (July 2008)
| Address: | VIA ROBERTO AGO 26 POSTAL CODE 00166 |
| Rome, ITALY | |
| Phone # for sales: | +393357540708 |
| E-mail address: | pezzutti.paolo@tiscali.it |
Click here for more information about our publications!
Comments
Date: 04/18/07Rank: 3Comment:

Request Information From Our Sponsors
- StockCharts.com, Inc.
- Candle Patterns
- Candlestick Charting Explained
- Intermarket Technical Analysis
- John Murphy on Chart Analysis
- John Murphy's Chart Pattern Recognition
- John Murphy's Market Message
- MurphyExplainsMarketAnalysis-Intermarket Analysis
- MurphyExplainsMarketAnalysis-Visual Analysis
- StockCharts.com
- Technical Analysis of the Financial Markets
- The Visual Investor
- VectorVest, Inc.
- Executive Premier Workshop
- One-Day Options Course
- OptionsPro
- Retirement Income Workshop
- Sure-Fire Trading Systems (VectorVest, Inc.)
- Trading as a Business Workshop
- VectorVest 7 EOD
- VectorVest 7 RealTime/IntraDay
- VectorVest AutoTester
- VectorVest Educational Services
- VectorVest OnLine
- VectorVest Options Analyzer
- VectorVest ProGraphics v6.0
- VectorVest ProTrader 7
- VectorVest RealTime Derby Tool
- VectorVest Simulator
- VectorVest Variator
- VectorVest Watchdog
