HOT TOPICS LIST
- MACD
- Fibonacci
- RSI
- Gann
- ADXR
- Stochastics
- Volume
- Triangles
- Futures
- Cycles
- Volatility
- ZIGZAG
- MESA
- Retracement
- Aroon
INDICATORS LIST
LIST OF TOPICS
PRINT THIS ARTICLE
by Arthur Hill
A breakdown in late February and a dead cross in late March are enough to turn medium-term bearish on Bank of America. This bodes ill for the biggest sector in the S&P 500.
Position: Sell
Arthur Hill
Arthur Hill is currently editor of TDTrader.com, a website specializing in trading strategies, sector/industry specific breadth stats and overall technical analysis. He passed the Society of Technical Analysts (STA London) diploma exam with distinction is a Certified Financial Technician (CFTe). Prior to TD Trader, he was the Chief Technical Analyst for Stockcharts.com and the main contributor to the ChartSchool.
PRINT THIS ARTICLE
REL. STR COMPARATIVE
A Dead Cross For Bank Of America
04/09/07 01:47:40 PMby Arthur Hill
A breakdown in late February and a dead cross in late March are enough to turn medium-term bearish on Bank of America. This bodes ill for the biggest sector in the S&P 500.
Position: Sell
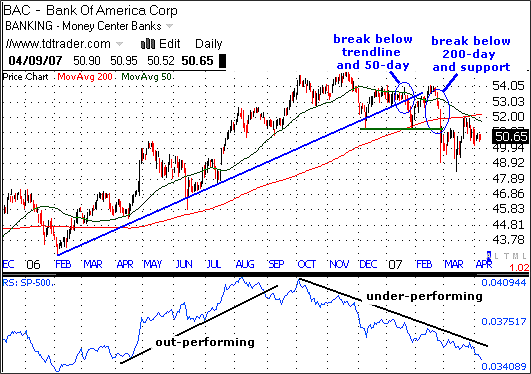
| Bank of America (BAC) is one of the biggest banks around and a key component of the finance sector. This is the biggest sector in the Standard & Poor's 500, in fact, and the weakness here would be quite bearish for the market as a whole. Bank of America can be used as a proxy for the finance sector and by extension the S&P 500. What's bullish for BAC is bullish for finance and the S&P 500, and what's bearish for BAC is bearish for finance and the S&P 500. Figure 1, which shows the current chart, looks bearish, and so this is bearish for the finance sector and the S&P 500. |

|
| FIGURE 1: BANK OF AMERICA, DAILY. BAC broke down in late February, and the March recovery came up short. |
| Graphic provided by: Telechart 2007. |
| |
| BAC broke down in late February 2007, and the March recovery is coming up short. The stock first broke the October 2005 trendline and the 50-day moving average in January 2007. BAC managed to hold up after this, but the stock gapped down and broke support at 51.25 with a sharp decline in late February 2007. The December 2006 and January 2007 lows marked support at 51.25, and the lower low reflects a new level of selling pressure. The bears are getting stronger, not weaker. In addition to this support break, the stock also broke below the 50-day and 200-day moving average. With prices below the 200-day moving average, this suggests that most buyers over the last 200 days are now losing money. |
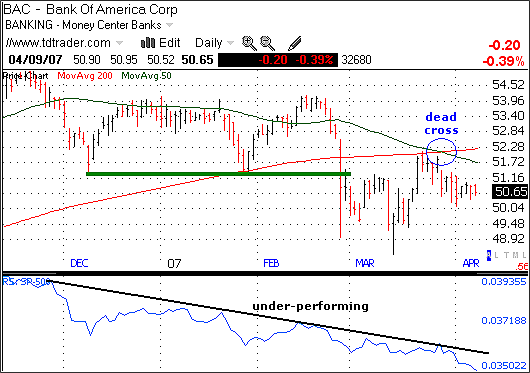
| The stock bounced in mid-March, but this bounce met resistance right where it should have and the stock continues to show relative weakness. Broken support turns into resistance around 51.26 and the broken moving averages turn into resistance. They all converged around 51-52 and the stock was turned back over the last few weeks. The 50-day simple moving average (SMA) moved below the 200-day SMA, and this dead cross is also bearish (Figure 2). Even more disconcerting, the price relative continued to trend lower during the last rally. The stock remains weaker than the S&P 500, and BAC currently looks out of favor. |

|
| FIGURE 2: BANK OF AMERICA, DAILY. The 50-day moving average and the 200-day moving average converged, with the 50-day moving below the 200-day, which was bearish. |
| Graphic provided by: Telechart 2007. |
| |
| What now? The breakdown is clearly bearish and this has yet to be proven otherwise. The stock has traded flat since early March, but resistance held at around 52 and the stock remains below both key moving averages. I find this bearish and would expect lower prices in the coming weeks and months. A break above late March would call for a reassessment of my bearish prognosis. |
Arthur Hill is currently editor of TDTrader.com, a website specializing in trading strategies, sector/industry specific breadth stats and overall technical analysis. He passed the Society of Technical Analysts (STA London) diploma exam with distinction is a Certified Financial Technician (CFTe). Prior to TD Trader, he was the Chief Technical Analyst for Stockcharts.com and the main contributor to the ChartSchool.
| Title: | Editor |
| Company: | TDTrader.com |
| Address: | Willem Geetsstraat 17 |
| Mechelen, B2800 | |
| Phone # for sales: | 3215345465 |
| Website: | www.tdtrader.com |
| E-mail address: | arthurh@tdtrader.com |
Traders' Resource Links | |
| TDTrader.com has not added any product or service information to TRADERS' RESOURCE. | |
Click here for more information about our publications!
Comments
Date: 04/09/07Rank: 4Comment:

Request Information From Our Sponsors
- StockCharts.com, Inc.
- Candle Patterns
- Candlestick Charting Explained
- Intermarket Technical Analysis
- John Murphy on Chart Analysis
- John Murphy's Chart Pattern Recognition
- John Murphy's Market Message
- MurphyExplainsMarketAnalysis-Intermarket Analysis
- MurphyExplainsMarketAnalysis-Visual Analysis
- StockCharts.com
- Technical Analysis of the Financial Markets
- The Visual Investor
- VectorVest, Inc.
- Executive Premier Workshop
- One-Day Options Course
- OptionsPro
- Retirement Income Workshop
- Sure-Fire Trading Systems (VectorVest, Inc.)
- Trading as a Business Workshop
- VectorVest 7 EOD
- VectorVest 7 RealTime/IntraDay
- VectorVest AutoTester
- VectorVest Educational Services
- VectorVest OnLine
- VectorVest Options Analyzer
- VectorVest ProGraphics v6.0
- VectorVest ProTrader 7
- VectorVest RealTime Derby Tool
- VectorVest Simulator
- VectorVest Variator
- VectorVest Watchdog
