HOT TOPICS LIST
- MACD
- Fibonacci
- RSI
- Gann
- ADXR
- Stochastics
- Volume
- Triangles
- Futures
- Cycles
- Volatility
- ZIGZAG
- MESA
- Retracement
- Aroon
INDICATORS LIST
LIST OF TOPICS
PRINT THIS ARTICLE
by Chaitali Mohile
The bullish rally was struck by a gap down, whipsawing many long trades.
Position: N/A
Chaitali Mohile
Active trader in the Indian stock markets since 2003 and a full-time writer. Trading is largely based upon technical analysis.
PRINT THIS ARTICLE
GAPS
Cutera Gaps In Bullish Rally
04/10/07 10:39:08 AMby Chaitali Mohile
The bullish rally was struck by a gap down, whipsawing many long trades.
Position: N/A
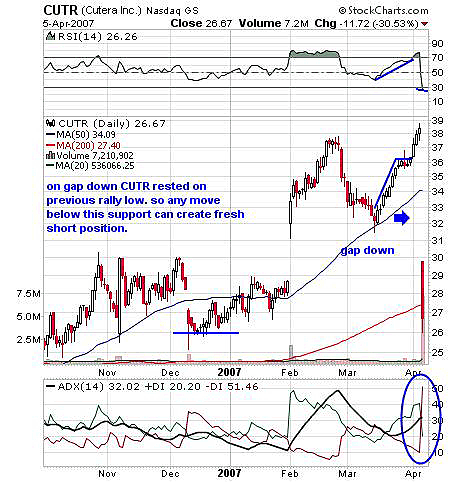
| Gaps are always unpredictable; there are numerous reasons for a gap breakout/breakdown. On Figure 1, Cutera Inc. gapped down suddenly amid the bullish rally. Technically, few reasons for a down move can be seen on the chart, but some strong news after closing can make a gap down. In Figure 1, the price moved closer to the flag & pennant target of $40. The previous high is another strong resistance for a bullish rally. Though the price broke out, the upside move was obstructed by the resistance. |

|
| FIGURE 1: CUTR, DAILY. Long-side traders were faced with a sudden gap down. Various technical reasons for a downfall can be seen on the chart, but the gap down was certainly unpredictable. |
| Graphic provided by: StockCharts.com. |
| |
| The relative strength index (RSI)(14) became overbought at 70. Though it can remain overbought for longer periods, the weak rally can drag the indicator down. With a sudden gap down, the indicator moved to 30. If it holds there, then we can expect a relief rally. This gap down has also affected the well-developed bullish trend by sharply increasing the number of sellers. |
| How can this gap be traded? A massive fall can be expected if the price moves below this support, so traders can get a short position opportunity if this support is violated. If not, then some range-bound move is possible. |
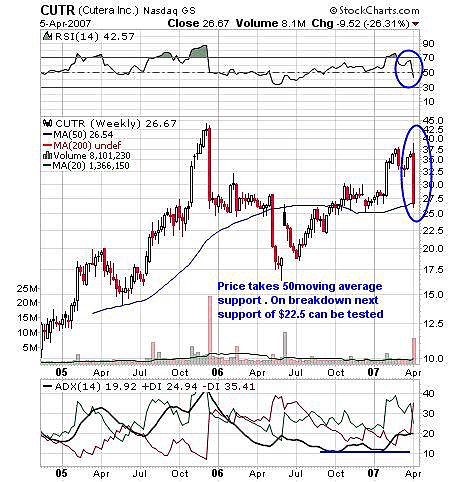
| Let's see whether Figure 2, the weekly chart of CUTR, also has some strong support at $26. This chart has established support on the 50-day moving average, so now this adds strength to the $26 level. The bullish rally was not accompanied by enthusiastic volume. In addition, the RSI (14) made a lower high, indicating a lack of strength. The ADX (14) indicates a developing bullish trend, and until the price upholds its support of the 50-day moving average, the trend will remain up. |

|
| FIGURE 2: CUTR, WEEKLY. The stock price established support on the 50-day moving average. |
| Graphic provided by: StockCharts.com. |
| |
| Considering both Figures 1 and 2, traders should keep away from this stock till some strong bullish indication can be seen. Otherwise, a gap down can cause a serious fall opening short. |
Active trader in the Indian stock markets since 2003 and a full-time writer. Trading is largely based upon technical analysis.
| Company: | Independent |
| Address: | C1/3 Parth Indraprasth Towers. Vastrapur |
| Ahmedabad, Guj 380015 | |
| E-mail address: | chaitalimohile@yahoo.co.in |
Traders' Resource Links | |
| Independent has not added any product or service information to TRADERS' RESOURCE. | |
Click here for more information about our publications!
Comments
Date: 04/10/07Rank: 4Comment:

Request Information From Our Sponsors
- StockCharts.com, Inc.
- Candle Patterns
- Candlestick Charting Explained
- Intermarket Technical Analysis
- John Murphy on Chart Analysis
- John Murphy's Chart Pattern Recognition
- John Murphy's Market Message
- MurphyExplainsMarketAnalysis-Intermarket Analysis
- MurphyExplainsMarketAnalysis-Visual Analysis
- StockCharts.com
- Technical Analysis of the Financial Markets
- The Visual Investor
- VectorVest, Inc.
- Executive Premier Workshop
- One-Day Options Course
- OptionsPro
- Retirement Income Workshop
- Sure-Fire Trading Systems (VectorVest, Inc.)
- Trading as a Business Workshop
- VectorVest 7 EOD
- VectorVest 7 RealTime/IntraDay
- VectorVest AutoTester
- VectorVest Educational Services
- VectorVest OnLine
- VectorVest Options Analyzer
- VectorVest ProGraphics v6.0
- VectorVest ProTrader 7
- VectorVest RealTime Derby Tool
- VectorVest Simulator
- VectorVest Variator
- VectorVest Watchdog
