HOT TOPICS LIST
- MACD
- Fibonacci
- RSI
- Gann
- ADXR
- Stochastics
- Volume
- Triangles
- Futures
- Cycles
- Volatility
- ZIGZAG
- MESA
- Retracement
- Aroon
INDICATORS LIST
LIST OF TOPICS
PRINT THIS ARTICLE
by Chaitali Mohile
The bearish flag keeps GBX in a downtrend. In addition, crucial supports are violated, confirming a continuing downward rally with a target of $19.
Position: Sell
Chaitali Mohile
Active trader in the Indian stock markets since 2003 and a full-time writer. Trading is largely based upon technical analysis.
PRINT THIS ARTICLE
FLAGS AND PENNANTS
Greenbrier Cos. Remains In Downtrend
04/10/07 01:22:34 PMby Chaitali Mohile
The bearish flag keeps GBX in a downtrend. In addition, crucial supports are violated, confirming a continuing downward rally with a target of $19.
Position: Sell
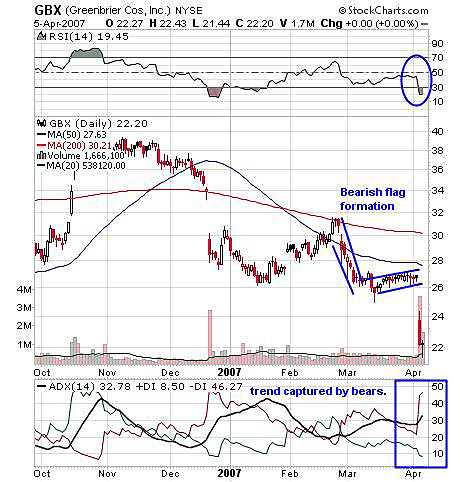
| A bearish flag & pennant formation is a bearish continuation pattern of the previous downward rally. Greenbrier (GBX) has been in a downtrend since mid-November 2006. The price of GBX crossed the 200-day moving average support and the 50-day moving average and also delivered a bearish moving average crossover, reconfirming the downtrend. The daily chart (Figure 1) shows the bearish flag & pennant breakout, indicating the possibility of a further downtrend in the stock. The price has already moved out of formation, heading down. |
| Figure 1 shows that the average directional movement index (ADX)(14) has already turned bearish. The breakdown from the flag & pennant formation has brought in more sellers, so the bearish trend became stronger. The relative strength index (RSI)(14) was meandering without a clear direction, in the range of 50-30. As a result, the price consolidated and formed a flag where neither buyers nor sellers traded. But as the RSI moved below 30, the price broke down and the sellers' volume increased. At present, the RSI(14) is oversold and can remain in the same condition for a longer period. |

|
| FIGURE 1: GBX, DAILY. GBX is likely to remain in a downtrend. The bearish flag & pennant breakout will lead to a downside level to $19 |
| Graphic provided by: StockCharts.com. |
| |
| As in the bullish flag & pennant formation, the target of the bearish formation is also calculated on the length of the flagpole, so on GBX the bearish flagpole size is $5 (that is, $31 - $26). By subtracting $5 from $24 (breakdown level), the short position target is $19. Traders may want to go short with a target of $19. |
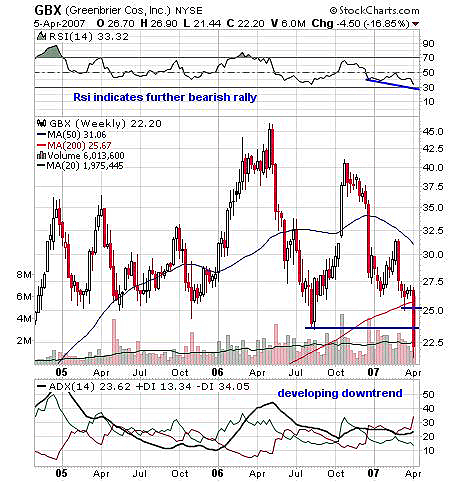
| The price failed to make a new high, with its pullback from the low roughly at $24.50. The stock then made lower highs and finally moved below its 200-day moving average support. This price is also moving below its previous low of $24.50. Traders can expect more downside as both major supports are violated. The RSI (14) at 33 indicate more of a bearish rally; ADX(14) also shows a developing downtrend (Figure 2). In this case, traders can note the conflict between bears and bulls, with the bears winning. |

|
| FIGURE 2: GBX, WEEKLY. Here, the price has moved below its previous low so more of a downward rally can be expected. |
| Graphic provided by: StockCharts.com. |
| |
| As a result, a downtrend will continue in GBX as a bearish flag & pennant formation is formed. The major supports are also being taken off, and thus, traders can take a short trade with a target of $19. |
Active trader in the Indian stock markets since 2003 and a full-time writer. Trading is largely based upon technical analysis.
| Company: | Independent |
| Address: | C1/3 Parth Indraprasth Towers. Vastrapur |
| Ahmedabad, Guj 380015 | |
| E-mail address: | chaitalimohile@yahoo.co.in |
Traders' Resource Links | |
| Independent has not added any product or service information to TRADERS' RESOURCE. | |
Click here for more information about our publications!
Comments
Date: 04/10/07Rank: 4Comment:

Request Information From Our Sponsors
- VectorVest, Inc.
- Executive Premier Workshop
- One-Day Options Course
- OptionsPro
- Retirement Income Workshop
- Sure-Fire Trading Systems (VectorVest, Inc.)
- Trading as a Business Workshop
- VectorVest 7 EOD
- VectorVest 7 RealTime/IntraDay
- VectorVest AutoTester
- VectorVest Educational Services
- VectorVest OnLine
- VectorVest Options Analyzer
- VectorVest ProGraphics v6.0
- VectorVest ProTrader 7
- VectorVest RealTime Derby Tool
- VectorVest Simulator
- VectorVest Variator
- VectorVest Watchdog
- StockCharts.com, Inc.
- Candle Patterns
- Candlestick Charting Explained
- Intermarket Technical Analysis
- John Murphy on Chart Analysis
- John Murphy's Chart Pattern Recognition
- John Murphy's Market Message
- MurphyExplainsMarketAnalysis-Intermarket Analysis
- MurphyExplainsMarketAnalysis-Visual Analysis
- StockCharts.com
- Technical Analysis of the Financial Markets
- The Visual Investor
