HOT TOPICS LIST
- MACD
- Fibonacci
- RSI
- Gann
- ADXR
- Stochastics
- Volume
- Triangles
- Futures
- Cycles
- Volatility
- ZIGZAG
- MESA
- Retracement
- Aroon
INDICATORS LIST
LIST OF TOPICS
PRINT THIS ARTICLE
by David Penn
March came in like a lion ... with a market bottom in tow.
Position: N/A
David Penn
Technical Writer for Technical Analysis of STOCKS & COMMODITIES magazine, Working-Money.com, and Traders.com Advantage.
PRINT THIS ARTICLE
REVERSAL
The Q's Hourly Double Bottom And Successful Test
04/05/07 08:35:36 AMby David Penn
March came in like a lion ... with a market bottom in tow.
Position: N/A
| "In like a lion and out like a lamb," goes the old saw about the month of March. But as far as QQQQ investors are concerned, it might be more accurate to suggest that March comes in like a bear and goes out like a bull. |
| The QQQQ, the tracking stock for the NASDAQ 100 index, peaked near 45.50 in late February and failed to follow through on the higher high it had just set (see my March 2, 2007, Traders.com Advantage article, "The QQQQ's 2B Top"). The QQQQ spent the balance of February in freefall, plummeting to just above 42. The NASDAQ 100 tracking stock then spent the first half of March scuttling along support at the 42–42.50 level, once bouncing as high as 43.25 before falling back toward 42. |

|
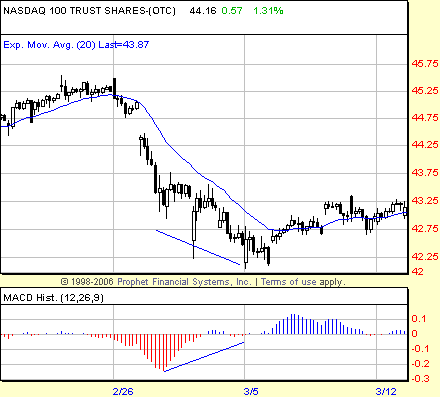
| FIGURE 1: NASDAQ 100 TRUST (QQQQ), HOURLY. A positive divergence in the MACD histogram helped warn traders and speculators that momentum to the downside was waning in early March. |
| Graphic provided by: Prophet Financial, Inc. |
| |
| This bouncing managed to produce a double bottom in the QQQQ between the initial trough low on March 5 and the second trough low on March 14. The initial trough was lower than the subsequent one and was itself telegraphed as a significant low by the positive divergence in the moving average convergence/divergence (MACD) histogram (see Figure 1). |

|
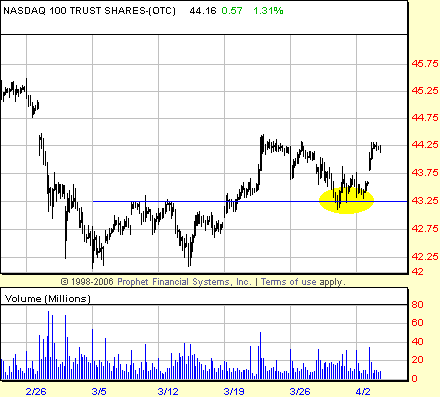
| FIGURE 2: NASDAQ 100 TRUST (QQQQ), HOURLY. The QQQQ broke out from its double bottom and managed to reach its minimum upside target before pulling back. Note how the QQQQ found support at approximately the same level of the breakout weeks before. |
| Graphic provided by: Prophet Financial, Inc. |
| |
| The peak between troughs was just north of 43.25, which, when the low point of the two troughs (roughly 42.25) was subtracted from it, meant that a successful breakout from the double bottom would create a minimum upside move to the 44.25 level. |
| This move was precisely what the QQQQ did. Breaking out on March 20, the QQQQ one day later reached the minimum upside target of 44.25 (Figure 2). Shortly thereafter, the market pulled back. But interestingly, the pullback appears to have found support near the 43.25 level, precisely where the QQQQ originally broke out. There is even a modest positive divergence in the MACD histogram on the rest of the breakout level that further confirms the QQQQ's ability to bound higher from that level. The particularly bullish action on Tuesday, following the successful test, seems to indicate as much. |
Technical Writer for Technical Analysis of STOCKS & COMMODITIES magazine, Working-Money.com, and Traders.com Advantage.
| Title: | Technical Writer |
| Company: | Technical Analysis, Inc. |
| Address: | 4757 California Avenue SW |
| Seattle, WA 98116 | |
| Phone # for sales: | 206 938 0570 |
| Fax: | 206 938 1307 |
| Website: | www.Traders.com |
| E-mail address: | DPenn@traders.com |
Traders' Resource Links | |
| Charting the Stock Market: The Wyckoff Method -- Books | |
| Working-Money.com -- Online Trading Services | |
| Traders.com Advantage -- Online Trading Services | |
| Technical Analysis of Stocks & Commodities -- Publications and Newsletters | |
| Working Money, at Working-Money.com -- Publications and Newsletters | |
| Traders.com Advantage -- Publications and Newsletters | |
| Professional Traders Starter Kit -- Software | |
Click here for more information about our publications!
Comments
Date: 04/06/07Rank: 3Comment:

Request Information From Our Sponsors
- StockCharts.com, Inc.
- Candle Patterns
- Candlestick Charting Explained
- Intermarket Technical Analysis
- John Murphy on Chart Analysis
- John Murphy's Chart Pattern Recognition
- John Murphy's Market Message
- MurphyExplainsMarketAnalysis-Intermarket Analysis
- MurphyExplainsMarketAnalysis-Visual Analysis
- StockCharts.com
- Technical Analysis of the Financial Markets
- The Visual Investor
- VectorVest, Inc.
- Executive Premier Workshop
- One-Day Options Course
- OptionsPro
- Retirement Income Workshop
- Sure-Fire Trading Systems (VectorVest, Inc.)
- Trading as a Business Workshop
- VectorVest 7 EOD
- VectorVest 7 RealTime/IntraDay
- VectorVest AutoTester
- VectorVest Educational Services
- VectorVest OnLine
- VectorVest Options Analyzer
- VectorVest ProGraphics v6.0
- VectorVest ProTrader 7
- VectorVest RealTime Derby Tool
- VectorVest Simulator
- VectorVest Variator
- VectorVest Watchdog
