HOT TOPICS LIST
- MACD
- Fibonacci
- RSI
- Gann
- ADXR
- Stochastics
- Volume
- Triangles
- Futures
- Cycles
- Volatility
- ZIGZAG
- MESA
- Retracement
- Aroon
INDICATORS LIST
LIST OF TOPICS
PRINT THIS ARTICLE
by Arthur Hill
After two months of flat trading, Deere & Co. established a directional bias with a support break.
Position: Sell
Arthur Hill
Arthur Hill is currently editor of TDTrader.com, a website specializing in trading strategies, sector/industry specific breadth stats and overall technical analysis. He passed the Society of Technical Analysts (STA London) diploma exam with distinction is a Certified Financial Technician (CFTe). Prior to TD Trader, he was the Chief Technical Analyst for Stockcharts.com and the main contributor to the ChartSchool.
PRINT THIS ARTICLE
ACCUM./DIST. CHAIKIN
Deere Breaks Down On Big Volume
04/03/07 09:20:17 AMby Arthur Hill
After two months of flat trading, Deere & Co. established a directional bias with a support break.
Position: Sell
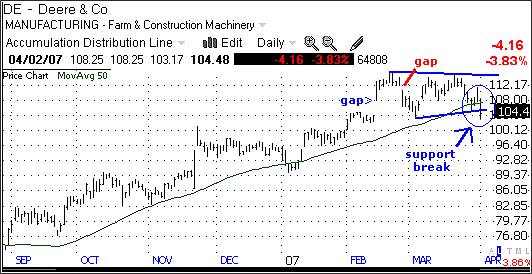
| Deere & Co. (DE) has been a top performer over the last few months, with a run from around 70 to 115 (up 64% from mid-August to late February) (Figure 1). While this run is impressive, a meaningful correction has yet to unfold, and the recent breakdown signals the start of at least a correction. |

|
| FIGURE 1: DEERE & CO., DAILY. DE has had a runup of 64% from mid-August 2006 to late February 2007. |
| Graphic provided by: TC2000.com. |
| Graphic provided by: Telechart 2007. |
| |
| The stock surged above 110 in mid-February and then stalled the next six weeks. This stalling formed a triangle of sorts and the stock found support from its 50-day simple moving average. Except for a few days in early January, the 50-day moving average held throughout the advance. Note that the early January break occurred on relatively light volume and the stock quickly recovered. The current break is different because it occurred on high volume and coincided with a triangle support break. |

|
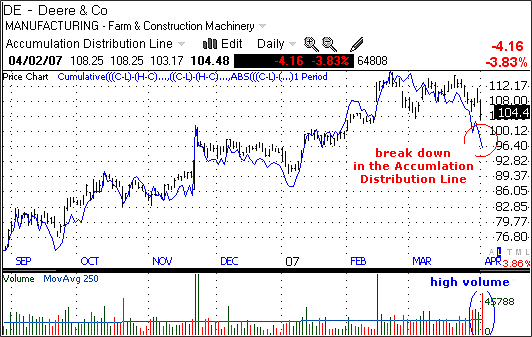
| FIGURE 2: DEERE & CO., DAILY. In addition to the breakdown on rising volume, the accumulation-distribution line broke down in recent weeks. |
| Graphic provided by: Telechart 2007. |
| |
| In addition to the breakdown on rising volume, the accumulation-distribution line broke down over the last few weeks (Figure 2). The indicator peaked in late February, edged lower in early March, and declined sharply in the last two weeks. The decline reflects increasing selling pressure, and the stock is being distributed. |
| Where do we go from here? The August 2006–February 2007 advance is in need of a correction, and a 50% retracement would extend to 92. Taking back half of a rally is normal for a correction. In addition, broken resistance from the October high turned into support around 90, and this was verified with the bounce in early January. The combination makes for a target around 90–92. |
Arthur Hill is currently editor of TDTrader.com, a website specializing in trading strategies, sector/industry specific breadth stats and overall technical analysis. He passed the Society of Technical Analysts (STA London) diploma exam with distinction is a Certified Financial Technician (CFTe). Prior to TD Trader, he was the Chief Technical Analyst for Stockcharts.com and the main contributor to the ChartSchool.
| Title: | Editor |
| Company: | TDTrader.com |
| Address: | Willem Geetsstraat 17 |
| Mechelen, B2800 | |
| Phone # for sales: | 3215345465 |
| Website: | www.tdtrader.com |
| E-mail address: | arthurh@tdtrader.com |
Traders' Resource Links | |
| TDTrader.com has not added any product or service information to TRADERS' RESOURCE. | |
Click here for more information about our publications!
Comments
Date: 04/06/07Rank: 4Comment:
Date: 04/06/07Rank: 5Comment: Do you have any articles on Price Patterns, in particular,on Gaps Triangles?

Request Information From Our Sponsors
- VectorVest, Inc.
- Executive Premier Workshop
- One-Day Options Course
- OptionsPro
- Retirement Income Workshop
- Sure-Fire Trading Systems (VectorVest, Inc.)
- Trading as a Business Workshop
- VectorVest 7 EOD
- VectorVest 7 RealTime/IntraDay
- VectorVest AutoTester
- VectorVest Educational Services
- VectorVest OnLine
- VectorVest Options Analyzer
- VectorVest ProGraphics v6.0
- VectorVest ProTrader 7
- VectorVest RealTime Derby Tool
- VectorVest Simulator
- VectorVest Variator
- VectorVest Watchdog
- StockCharts.com, Inc.
- Candle Patterns
- Candlestick Charting Explained
- Intermarket Technical Analysis
- John Murphy on Chart Analysis
- John Murphy's Chart Pattern Recognition
- John Murphy's Market Message
- MurphyExplainsMarketAnalysis-Intermarket Analysis
- MurphyExplainsMarketAnalysis-Visual Analysis
- StockCharts.com
- Technical Analysis of the Financial Markets
- The Visual Investor
