HOT TOPICS LIST
- MACD
- Fibonacci
- RSI
- Gann
- ADXR
- Stochastics
- Volume
- Triangles
- Futures
- Cycles
- Volatility
- ZIGZAG
- MESA
- Retracement
- Aroon
INDICATORS LIST
LIST OF TOPICS
PRINT THIS ARTICLE
by Chaitali Mohile
The bearish pattern in the daily chart and the previous resistance in the weekly frame may drag down LivePerson, Inc.
Position: N/A
Chaitali Mohile
Active trader in the Indian stock markets since 2003 and a full-time writer. Trading is largely based upon technical analysis.
PRINT THIS ARTICLE
WEDGE FORMATIONS
LivePerson In Dark Shadow
04/04/07 08:07:34 AMby Chaitali Mohile
The bearish pattern in the daily chart and the previous resistance in the weekly frame may drag down LivePerson, Inc.
Position: N/A
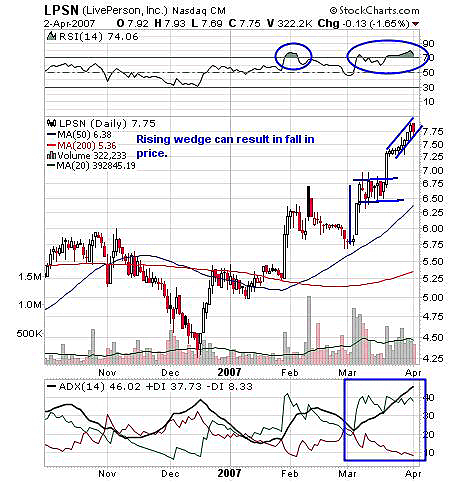
| LivePerson, Inc., has a rising wedge on its daily chart (Figure 1). This stock highlights the reversal pattern of a bearish wedge. Here, the wedge is sloping upward in the direction of the existing trend, but the breakout direction will be down. After breaking out at $6.75, the bullish candle signal moved to $7.25. Then the rising wedge was formed. The stock may test its lows as a result, moving deeper. |
| The relative strength index (RSI)(14) seems unable to carry above 70. The marked circles presented on Figure 1 indicates how the RSI (14) went to 70 and then slipped below 50. And at current levels, the RSI has turned down, intending to repeat history. The average directional moving index (ADX)(14), which is at an overheated level of 46, can face some decline too. But traders should note that this decline in ADX would not change the overall trend. |

|
| FIGURE 1: LSPN, DAILY. The rising wedge is likely to bring a temporary fall in price. |
| Graphic provided by: StockCharts.com. |
| |
| The bearish formation, and a poor signal on both indicators, suggest that LivePerson, Inc. (LPSN), is likely to dip in the future. I would suggest that traders take their profits and remain on the sidelines till indications turn strongly bullish. |
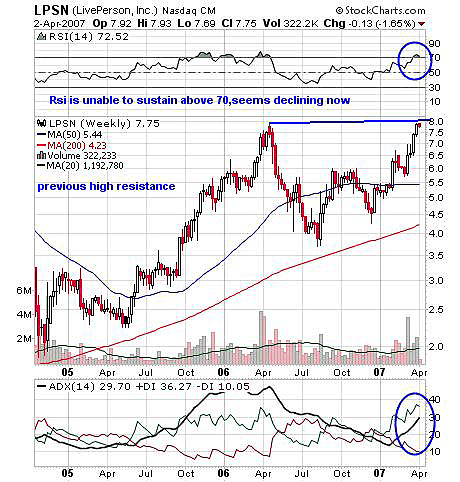
| LPSN faces previous high resistance on its weekly chart (Figure 2). This resistance itself can pull down the stock. Though the price moves almost $3.50 with a strong moving average from $5.50 to $8, the previous high resistance equally resists the bullish rally. The RSI (14) in Figure 2 is showing a declining move above 70. The ADX (14) has moved above 20, indicating a developing moving average. |

|
| FIGURE 2: LSPN, WEEKLY. The previous high resistance can push down the price. |
| Graphic provided by: StockCharts.com. |
| |
| The daily chart formed a bearish pattern and the weekly chart faced the previous high resistance. Both are among the major obstacles in a bullish rally. Hence, LPSN is likely to correct. |
Active trader in the Indian stock markets since 2003 and a full-time writer. Trading is largely based upon technical analysis.
| Company: | Independent |
| Address: | C1/3 Parth Indraprasth Towers. Vastrapur |
| Ahmedabad, Guj 380015 | |
| E-mail address: | chaitalimohile@yahoo.co.in |
Traders' Resource Links | |
| Independent has not added any product or service information to TRADERS' RESOURCE. | |
Click here for more information about our publications!
Comments
Date: 04/06/07Rank: 4Comment:

Request Information From Our Sponsors
- StockCharts.com, Inc.
- Candle Patterns
- Candlestick Charting Explained
- Intermarket Technical Analysis
- John Murphy on Chart Analysis
- John Murphy's Chart Pattern Recognition
- John Murphy's Market Message
- MurphyExplainsMarketAnalysis-Intermarket Analysis
- MurphyExplainsMarketAnalysis-Visual Analysis
- StockCharts.com
- Technical Analysis of the Financial Markets
- The Visual Investor
- VectorVest, Inc.
- Executive Premier Workshop
- One-Day Options Course
- OptionsPro
- Retirement Income Workshop
- Sure-Fire Trading Systems (VectorVest, Inc.)
- Trading as a Business Workshop
- VectorVest 7 EOD
- VectorVest 7 RealTime/IntraDay
- VectorVest AutoTester
- VectorVest Educational Services
- VectorVest OnLine
- VectorVest Options Analyzer
- VectorVest ProGraphics v6.0
- VectorVest ProTrader 7
- VectorVest RealTime Derby Tool
- VectorVest Simulator
- VectorVest Variator
- VectorVest Watchdog
