HOT TOPICS LIST
- MACD
- Fibonacci
- RSI
- Gann
- ADXR
- Stochastics
- Volume
- Triangles
- Futures
- Cycles
- Volatility
- ZIGZAG
- MESA
- Retracement
- Aroon
INDICATORS LIST
LIST OF TOPICS
PRINT THIS ARTICLE
by David Penn
Inundated with calls to invest in biotech stocks? There are a few technical reasons why waiting shouldn't be the hardest part.
Position: N/A
David Penn
Technical Writer for Technical Analysis of STOCKS & COMMODITIES magazine, Working-Money.com, and Traders.com Advantage.
PRINT THIS ARTICLE
SUPPORT & RESISTANCE
Buy The Biotech Hype?
04/03/07 08:49:43 AMby David Penn
Inundated with calls to invest in biotech stocks? There are a few technical reasons why waiting shouldn't be the hardest part.
Position: N/A
| Biotechnology has been a sector in which a few intrepid traders have targeted as one where more than a few rewards can be found. As an example, this week's top story in BusinessWeek is headlined, "More Biotech Bets For The Fearless." Attention should be directed not so much to the "fearless" component of that headline, which only underscores the obviousness of risk when investing in oft-richly valued biotech stocks. Instead, it was the "more" that caught my eye — "more" as in, "'Fearless' or not, we're going to give you more 'bets' to consider." |

|
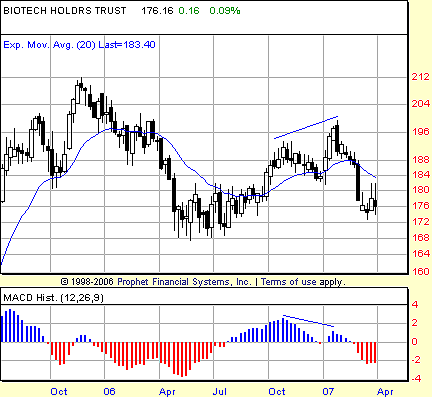
| FIGURE 1: BIOTECH HOLDRS TRUST, WEEKLY. A negative divergence in the MACD histogram between BBH's peaks in October 2006 and January 2007 anticipated the sharp correction in the first quarter of 2007. |
| Graphic provided by: Prophet Financial, Inc. |
| |
| I last wrote about biotechnology stocks back in the summer of 2006 for Working-Money.com ("Betting On Biotech," June 13, 2006). At the time, I wanted to focus on two things in biotechnology stocks that I thought would be helpful for traders and speculators. The first was the technical condition of the BBH, or biotechnology HOLDRS (Figure 1). The second was the seasonality of biotechnology stocks. The technical condition was one in which the group looked to be making at least a short-term bottom after peaking in the autumn of 2005. The seasonality — per the Hirsches and their Stock Traders Almanac — suggested that biotech stocks have a tendency to outperform during the period of July through March. |
| This approach would have worked well enough for the cohort of biotech stocks collected in the BBH up until late January, when a clear negative divergence in the MACD histogram warned investors that the upside in this group was limited. Shortly thereafter, the BBH slipped from just under 200 to about 175 by mid-March. |
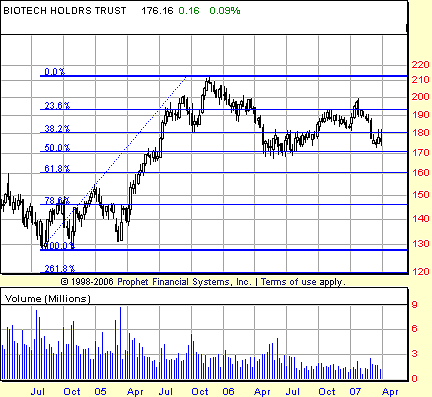
| The question is whether the lows of the summer of 2006 will continue to hold, providing support in the 170 area. The fact that the negative divergence that anticipated the 2007 correction appeared on the weekly chart (between the October 2005 and January 2006 peaks) suggests that the BBH might have more correction in store than the current dip has exacted (Figure 2). In fact, it would be too much to say that the BBH is approaching a make-or-break point in the spring of 2007. |

|
| FIGURE 2: BIOTECH HOLDRS TRUST, WEEKLY. The correction in BBH had retraced 50% of the bull market before bouncing significantly. Failure to find support as the market moves to retest the 50% retracement level would set up a lower test, most likely at the 61.8% Fibonacci retracement level. |
| Graphic provided by: Prophet Financial, Inc. |
| |
| If the lows from the summer of 2006 provide support, then the case for buying biotechs would be a strong one indeed. However, if those lows do not provide support, then a deeper correction — perhaps one that saw the BBH make a 61.8% Fibonacci retracement of the advance from 2004 to late 2005 rather than the more mild 50% retracement has completed thus far — is something that biotech investors and onlookers should expect. |
Technical Writer for Technical Analysis of STOCKS & COMMODITIES magazine, Working-Money.com, and Traders.com Advantage.
| Title: | Technical Writer |
| Company: | Technical Analysis, Inc. |
| Address: | 4757 California Avenue SW |
| Seattle, WA 98116 | |
| Phone # for sales: | 206 938 0570 |
| Fax: | 206 938 1307 |
| Website: | www.Traders.com |
| E-mail address: | DPenn@traders.com |
Traders' Resource Links | |
| Charting the Stock Market: The Wyckoff Method -- Books | |
| Working-Money.com -- Online Trading Services | |
| Traders.com Advantage -- Online Trading Services | |
| Technical Analysis of Stocks & Commodities -- Publications and Newsletters | |
| Working Money, at Working-Money.com -- Publications and Newsletters | |
| Traders.com Advantage -- Publications and Newsletters | |
| Professional Traders Starter Kit -- Software | |
Click here for more information about our publications!
Comments
Date: 04/04/07Rank: 5Comment:
Date: 04/06/07Rank: 3Comment:

Request Information From Our Sponsors
- StockCharts.com, Inc.
- Candle Patterns
- Candlestick Charting Explained
- Intermarket Technical Analysis
- John Murphy on Chart Analysis
- John Murphy's Chart Pattern Recognition
- John Murphy's Market Message
- MurphyExplainsMarketAnalysis-Intermarket Analysis
- MurphyExplainsMarketAnalysis-Visual Analysis
- StockCharts.com
- Technical Analysis of the Financial Markets
- The Visual Investor
- VectorVest, Inc.
- Executive Premier Workshop
- One-Day Options Course
- OptionsPro
- Retirement Income Workshop
- Sure-Fire Trading Systems (VectorVest, Inc.)
- Trading as a Business Workshop
- VectorVest 7 EOD
- VectorVest 7 RealTime/IntraDay
- VectorVest AutoTester
- VectorVest Educational Services
- VectorVest OnLine
- VectorVest Options Analyzer
- VectorVest ProGraphics v6.0
- VectorVest ProTrader 7
- VectorVest RealTime Derby Tool
- VectorVest Simulator
- VectorVest Variator
- VectorVest Watchdog
