HOT TOPICS LIST
- MACD
- Fibonacci
- RSI
- Gann
- ADXR
- Stochastics
- Volume
- Triangles
- Futures
- Cycles
- Volatility
- ZIGZAG
- MESA
- Retracement
- Aroon
INDICATORS LIST
LIST OF TOPICS
PRINT THIS ARTICLE
by Jayanthi Gopalakrishnan
Well, it looks like the Nasdaq has taken a rough beating, rougher than what was imaginable.
Position: N/A
Jayanthi Gopalakrishnan
PRINT THIS ARTICLE
SUPPORT & RESISTANCE
Is there a next support level for the Nasdaq?
11/22/00 03:32:27 PMby Jayanthi Gopalakrishnan
Well, it looks like the Nasdaq has taken a rough beating, rougher than what was imaginable.
Position: N/A
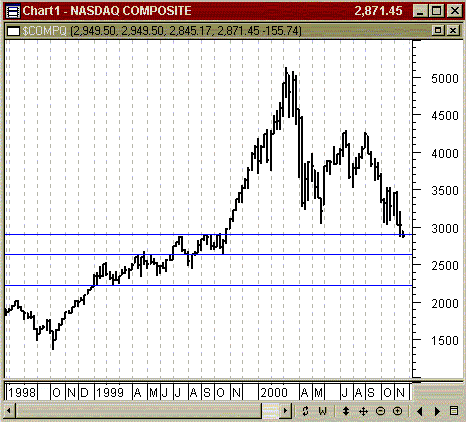
| My initial support level for the Nasdaq was at 3000. I had hoped that it would not fall below this level since that would indicate a painful downfall. Unfortunately this is what happened and it means that it is time to take a look at these charts again to see how much lower the index will go. |
| A glance at the weekly chart of the Nasdaq composite does not paint a pretty picture. There are no strong support levels and the three you see on the attached chart do not provide any strong convictions. |

|
| The weekly chart of the Nasdaq composite shows no signs of how low it can go. |
| Graphic provided by: MetaStock. |
| |
| So, how long could the Nasdaq go? Very low. It is almost as if it has entered an abyss. In reality, that will not be the case. It has to turn around somewhere but that somewhere is nowwhere in sight. I'm sure most investors will be waiting anxiously for this day to come and when it does you will know. |
| Title: | Editor |
| Company: | Technical Analysis of Stocks & Commodities |
| Address: | 4757 California Ave SW |
| Seattle, WA 98116 | |
| Website: | Traders.com |
| E-mail address: | Jayanthi@traders.com |
Traders' Resource Links | |
| Charting the Stock Market: The Wyckoff Method -- Books | |
| Working-Money.com -- Online Trading Services | |
| Traders.com Advantage -- Online Trading Services | |
| Technical Analysis of Stocks & Commodities -- Publications and Newsletters | |
| Working Money, at Working-Money.com -- Publications and Newsletters | |
| Traders.com Advantage -- Publications and Newsletters | |
| Professional Traders Starter Kit -- Software | |
Click here for more information about our publications!
Comments
Date: / /Rank: 1Comment:

Request Information From Our Sponsors
- StockCharts.com, Inc.
- Candle Patterns
- Candlestick Charting Explained
- Intermarket Technical Analysis
- John Murphy on Chart Analysis
- John Murphy's Chart Pattern Recognition
- John Murphy's Market Message
- MurphyExplainsMarketAnalysis-Intermarket Analysis
- MurphyExplainsMarketAnalysis-Visual Analysis
- StockCharts.com
- Technical Analysis of the Financial Markets
- The Visual Investor
- VectorVest, Inc.
- Executive Premier Workshop
- One-Day Options Course
- OptionsPro
- Retirement Income Workshop
- Sure-Fire Trading Systems (VectorVest, Inc.)
- Trading as a Business Workshop
- VectorVest 7 EOD
- VectorVest 7 RealTime/IntraDay
- VectorVest AutoTester
- VectorVest Educational Services
- VectorVest OnLine
- VectorVest Options Analyzer
- VectorVest ProGraphics v6.0
- VectorVest ProTrader 7
- VectorVest RealTime Derby Tool
- VectorVest Simulator
- VectorVest Variator
- VectorVest Watchdog
