HOT TOPICS LIST
- MACD
- Fibonacci
- RSI
- Gann
- ADXR
- Stochastics
- Volume
- Triangles
- Futures
- Cycles
- Volatility
- ZIGZAG
- MESA
- Retracement
- Aroon
INDICATORS LIST
LIST OF TOPICS
PRINT THIS ARTICLE
by Gary Grosschadl
Cadence Design Systems is the world's leading electronic design automation technologies and engineering services company.
Position: Sell
Gary Grosschadl
Independent Canadian equities trader and technical analyst based in Peterborough
Ontario, Canada.
PRINT THIS ARTICLE
DOUBLE TOPS
Has Cadence Design Systems Signaled A Possible Double Top?
04/02/07 09:12:56 AMby Gary Grosschadl
Cadence Design Systems is the world's leading electronic design automation technologies and engineering services company.
Position: Sell
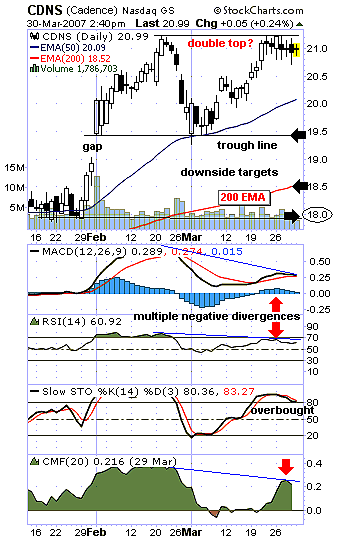
| Figure 1, the daily chart of Cadence Design Systems (CNDS), shows a possible double top in the early stages. Officially, a double top cannot be confirmed until the lower trendline (or troughline) is broken to the downside. However, several indicators hint that the double top will be tested. |
| One of the more reliable trading signals is a confluence of divergences, be they positive or negative. In this case, we see multiple negative divergences to price action. As the second peak was hit, several indicators failed to follow suit. This throws doubt to the validity of a move higher from here. More often than not, this spells a coming downleg, and the only question is: How far will it go? |

|
| FIGURE 1: CADENCE DESIGN, DAILY. This chart surmises a possible double top. |
| Graphic provided by: StockCharts.com. |
| |
| The moving average convergence/divergence (MACD) and the relative strength index (RSI) both show this negative divergence to price action. The stochastic oscillator shows an overbought condition that is starting to come down. A move below 80 is often a good confirmation that a stochastic downleg is under way, which relates to a downleg in price action. The Chaikin money flow (CMF) indicator also shows another negative divergence. Note how bullish buying power has declined at this second peak in price action. |
| Three downside targets are possible, should the stock not be rescued by early support from the 50-day exponential moving average (EMA), currently $20.09. The first is the trendline near $19.50. The violation here indicates that the double top is a valid pattern. Fulfillment of this double top would be equal to the distance from the trendline to the peak, applied to a downside move below the trendline. Not surprisingly, this relates to the previous low area near $18. Not to be ignored is the ever-important 200-day EMA, which is currently $18.52. This could cause a bounce or support from this level. |
| An aggressive trader would have to take early action — sell between here and the 50-day EMA to make this a worthwhile short-term trade, but as always, not without risk. A surprise move above the double top would negate the bearish tone of this article. |
Independent Canadian equities trader and technical analyst based in Peterborough
Ontario, Canada.
| Website: | www.whatsonsale.ca/financial.html |
| E-mail address: | gwg7@sympatico.ca |
Click here for more information about our publications!
Comments
Date: 04/06/07Rank: 5Comment:

Request Information From Our Sponsors
- StockCharts.com, Inc.
- Candle Patterns
- Candlestick Charting Explained
- Intermarket Technical Analysis
- John Murphy on Chart Analysis
- John Murphy's Chart Pattern Recognition
- John Murphy's Market Message
- MurphyExplainsMarketAnalysis-Intermarket Analysis
- MurphyExplainsMarketAnalysis-Visual Analysis
- StockCharts.com
- Technical Analysis of the Financial Markets
- The Visual Investor
- VectorVest, Inc.
- Executive Premier Workshop
- One-Day Options Course
- OptionsPro
- Retirement Income Workshop
- Sure-Fire Trading Systems (VectorVest, Inc.)
- Trading as a Business Workshop
- VectorVest 7 EOD
- VectorVest 7 RealTime/IntraDay
- VectorVest AutoTester
- VectorVest Educational Services
- VectorVest OnLine
- VectorVest Options Analyzer
- VectorVest ProGraphics v6.0
- VectorVest ProTrader 7
- VectorVest RealTime Derby Tool
- VectorVest Simulator
- VectorVest Variator
- VectorVest Watchdog
