HOT TOPICS LIST
- MACD
- Fibonacci
- RSI
- Gann
- ADXR
- Stochastics
- Volume
- Triangles
- Futures
- Cycles
- Volatility
- ZIGZAG
- MESA
- Retracement
- Aroon
INDICATORS LIST
LIST OF TOPICS
PRINT THIS ARTICLE
by David Penn
The current correction in the Dow Jones Industrial Average so far reflects little more than testing former resistance for present support.
Position: N/A
David Penn
Technical Writer for Technical Analysis of STOCKS & COMMODITIES magazine, Working-Money.com, and Traders.com Advantage.
PRINT THIS ARTICLE
BREAKOUTS
Testing The Breakout
03/29/07 09:53:43 AMby David Penn
The current correction in the Dow Jones Industrial Average so far reflects little more than testing former resistance for present support.
Position: N/A
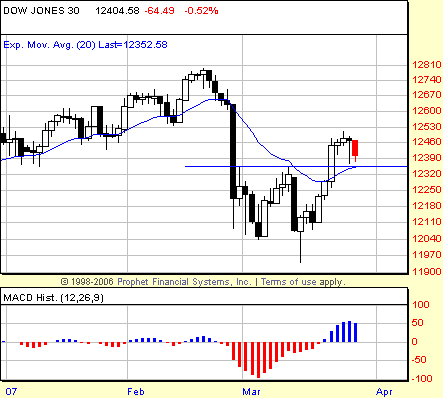
| In many ways, the mid-March 2007 bottom in the Dow Jones Industrial Average (DJIA) was textbook. Not only had pessimism ramped swiftly in the wake of the market's five-session/540-point collapse at the end of February, but the lower low in mid-March was accompanied by both positive divergences and a 2B bottom setup. That 2B bottom setup (see my Traders.com Advantage article "Short-Term Bottom In The S&P 500" from March 16, 2007) was filled three days after the lower low in mid-March at the 12190 level. Three days later, the Dow industrials were closing above 12460 (see Figure 1). |

|
| FIGURE 1: DJIA, DAILY. The industrials broke out from their bottom pattern in late March and are spending the balance of the month testing that level for support. Note that this support comes in both the form of the 20-day exponential moving average (EMA) as well as the intervening high between the two lows in early March and mid-March. The 20-day EMA had served as resistance during the industrials' initial attempt to move higher. |
| Graphic provided by: Prophet Financial, Inc. |
| |
| Since that close, the industrials have begun to consolidate. The range of this consolidation, so far, is roughly 12510 to 12360 — with the latter level also representing the breakout level, which is equivalent to the intervening high between the two troughs in March. There is a significant amount of support at the 12360 level, it seems. This support comes from both the 20-day exponential moving average (EMA) — which previously acted as resistance — as well as at the level of the intervening high. As such, there is a likelihood that, rather than correct sharply lower, the industrials will move sideways along the 12360 support level before vaulting higher again. |
| Applying the swing rule to the March bottom pattern — a sort of double bottom — suggests that when the industrials again begin moving higher, there is a good chance the current, year-to-date highs will be tested, if not exceeded. With a formation size of about 410 and a breakout level of 12360, the DJIA should be able to rally to at least the 12,770 level, which would make for an interesting challenge to the highs of late February, days before the industrials' minicrash. |

|
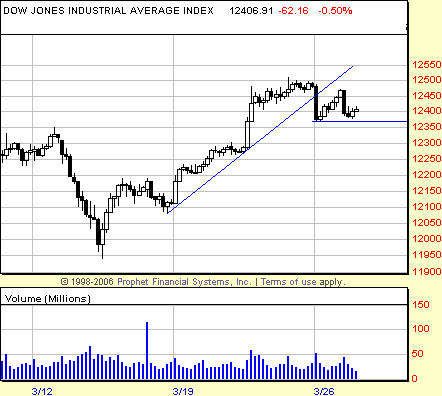
| FIGURE 2: DJIA, HOURLY. The rally in the industrials makes a short-term top and breakdown beneath its key trendline, setting up a 1-2-3 trend reversal test. In spite of large volume on the sell days since the trendline break, the industrials have yet to take out key support between 12,350 and 12,300. |
| Graphic provided by: Prophet Financial, Inc. |
| |
| Figure 2 shows the DJIA on an hourly basis. We can see how the bounce is, at root, a simple uptrend that has over the past several sessions broken down below the main trendline that has guided the advance. This allows us to use other trend-indicating tools to understand the progress of the rally and the prospects for any pullbacks. The 1-2-3 trend reversal test is just one of those trend-indicating tools. Essentially, the 1-2-3 test breaks the trend reversal into three stages. The first stage is the initial trendline break. The second stage represents the attempt by the market to reassert the trend that existed before the trendline break. The third stage occurs when the market fails to reassert the previous trend and move beyond the extreme point established in the first stage, the trendline break. |
| So far, the chart of the hourly industrials in Figure 2 shows clearly that the first stage — the trendline break — has taken place. At a minimum, the second stage has begun. It is hard to tell if the second stage is complete; the bounce and attempt to reassert the uptrend appears to have fallen quite short. In addition, the market has yet to move beyond the low of the initial trendline break. Right now, this is the area worth watching. Given the support nearby below, traders should be on guard for the possibility of a positive divergence — or even another, shorter-term, 2B test of bottom — signaling the end of this short-term downturn as well. |
Technical Writer for Technical Analysis of STOCKS & COMMODITIES magazine, Working-Money.com, and Traders.com Advantage.
| Title: | Technical Writer |
| Company: | Technical Analysis, Inc. |
| Address: | 4757 California Avenue SW |
| Seattle, WA 98116 | |
| Phone # for sales: | 206 938 0570 |
| Fax: | 206 938 1307 |
| Website: | www.Traders.com |
| E-mail address: | DPenn@traders.com |
Traders' Resource Links | |
| Charting the Stock Market: The Wyckoff Method -- Books | |
| Working-Money.com -- Online Trading Services | |
| Traders.com Advantage -- Online Trading Services | |
| Technical Analysis of Stocks & Commodities -- Publications and Newsletters | |
| Working Money, at Working-Money.com -- Publications and Newsletters | |
| Traders.com Advantage -- Publications and Newsletters | |
| Professional Traders Starter Kit -- Software | |
Click here for more information about our publications!
Comments
Date: 03/29/07Rank: 3Comment:

Request Information From Our Sponsors
- StockCharts.com, Inc.
- Candle Patterns
- Candlestick Charting Explained
- Intermarket Technical Analysis
- John Murphy on Chart Analysis
- John Murphy's Chart Pattern Recognition
- John Murphy's Market Message
- MurphyExplainsMarketAnalysis-Intermarket Analysis
- MurphyExplainsMarketAnalysis-Visual Analysis
- StockCharts.com
- Technical Analysis of the Financial Markets
- The Visual Investor
- VectorVest, Inc.
- Executive Premier Workshop
- One-Day Options Course
- OptionsPro
- Retirement Income Workshop
- Sure-Fire Trading Systems (VectorVest, Inc.)
- Trading as a Business Workshop
- VectorVest 7 EOD
- VectorVest 7 RealTime/IntraDay
- VectorVest AutoTester
- VectorVest Educational Services
- VectorVest OnLine
- VectorVest Options Analyzer
- VectorVest ProGraphics v6.0
- VectorVest ProTrader 7
- VectorVest RealTime Derby Tool
- VectorVest Simulator
- VectorVest Variator
- VectorVest Watchdog
