HOT TOPICS LIST
- MACD
- Fibonacci
- RSI
- Gann
- ADXR
- Stochastics
- Volume
- Triangles
- Futures
- Cycles
- Volatility
- ZIGZAG
- MESA
- Retracement
- Aroon
INDICATORS LIST
LIST OF TOPICS
PRINT THIS ARTICLE
by Gary Grosschadl
Is Ballard Power up for another break past its trading range?
Position: Accumulate
Gary Grosschadl
Independent Canadian equities trader and technical analyst based in Peterborough
Ontario, Canada.
PRINT THIS ARTICLE
CHART ANALYSIS
Ballard Power Systems Back In A Trading Range
03/29/07 10:17:25 AMby Gary Grosschadl
Is Ballard Power up for another break past its trading range?
Position: Accumulate
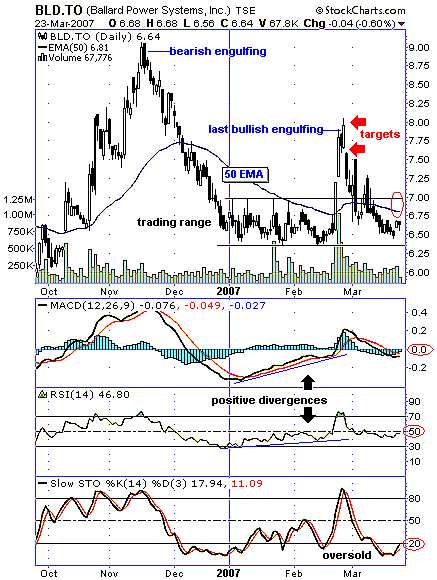
| Figure 1, the daily chart for Ballard Power Systems (BLD.TO), shows large price swings late in 2006, with a runup from $6 to $9 and then down to a trading range for the first quarter of 2007. A brief four-day explosion above the trading range occurred in late February 2007 and then withered back down. |
| As this stock is once again oversold by virtue of its stochastic oscillator, it bears another look. For another upleg to occur, two nearby resistances must be overcome. The first is the 50-day exponential moving average (EMA) currently at 6.81 and the second is $7, as defined by the long upper shadows from previous candlesticks. A close above these areas on large volume could herald another dash to test previous highs. Two short-term trading targets are shown at a previous gap area in the 7.60 area and the previous high in the vicinity of $8. A more sustained move could eventually test the next previous high of $9. |

|
| FIGURE 1: BALLARD POWER, DAILY. This chart shows Ballard battling a trading range. |
| Graphic provided by: StockCharts.com. |
| |
| Two candlestick patterns are worth mentioning, both marking previous highs. The first is a classic bearish engulfing pattern from last November. This two-day pattern is one of the more reliable signals of a top reversal. However, the second pattern is less understood, referring to the bullish engulfing pattern occurring at the top of the drive in late February. This is considered a "last bullish engulfing" pattern, a variation of the bullish engulfing pattern. This pattern is found after an extended bullish trend and is not a bullish signal. The pattern represents the bulls' final attempt to drive the market higher. If you are long and a last bullish engulfing pattern forms, you should identify a protective stop level near the lows of this pattern to protect any profit in the trade. This would have meant a sell on open (ideally) the next day, locking in the gain before profits evaporated in the next few weeks. |
| Note the positive divergences on the moving average convergence/divergence (MACD) and the relative strength index (RSI) prior to the last run to $8. While the stock price drifted sideways, these indicators moved into more bullish territory, hinting at a coming price move. Currently, these indicators are at potential stall levels, relating to the previous overhead resistance line of the 50-day EMA. Meanwhile, the stochastic oscillator is in oversold territory. A rise above the 20 level could herald a upleg developing. |
| Two short-term trading targets are possible should an upleg ensue: the gap area near $7.60 and the previous high at the $8 level. In the longer term, with possible rising support levels, the $9 mark could again be tested. Seeing as this is a volatile stock, the short-term targets are probably more realistic, provided that overhead resistance can be broken with conviction. |
Independent Canadian equities trader and technical analyst based in Peterborough
Ontario, Canada.
| Website: | www.whatsonsale.ca/financial.html |
| E-mail address: | gwg7@sympatico.ca |
Click here for more information about our publications!
Comments
Date: 03/29/07Rank: 5Comment:

Request Information From Our Sponsors
- StockCharts.com, Inc.
- Candle Patterns
- Candlestick Charting Explained
- Intermarket Technical Analysis
- John Murphy on Chart Analysis
- John Murphy's Chart Pattern Recognition
- John Murphy's Market Message
- MurphyExplainsMarketAnalysis-Intermarket Analysis
- MurphyExplainsMarketAnalysis-Visual Analysis
- StockCharts.com
- Technical Analysis of the Financial Markets
- The Visual Investor
- VectorVest, Inc.
- Executive Premier Workshop
- One-Day Options Course
- OptionsPro
- Retirement Income Workshop
- Sure-Fire Trading Systems (VectorVest, Inc.)
- Trading as a Business Workshop
- VectorVest 7 EOD
- VectorVest 7 RealTime/IntraDay
- VectorVest AutoTester
- VectorVest Educational Services
- VectorVest OnLine
- VectorVest Options Analyzer
- VectorVest ProGraphics v6.0
- VectorVest ProTrader 7
- VectorVest RealTime Derby Tool
- VectorVest Simulator
- VectorVest Variator
- VectorVest Watchdog
