HOT TOPICS LIST
- MACD
- Fibonacci
- RSI
- Gann
- ADXR
- Stochastics
- Volume
- Triangles
- Futures
- Cycles
- Volatility
- ZIGZAG
- MESA
- Retracement
- Aroon
INDICATORS LIST
LIST OF TOPICS
PRINT THIS ARTICLE
by Arthur Hill
The Semiconductor Index bounced with the rest of the market over the past few weeks, but the move looks like a bearish wedge.
Position: Hold
Arthur Hill
Arthur Hill is currently editor of TDTrader.com, a website specializing in trading strategies, sector/industry specific breadth stats and overall technical analysis. He passed the Society of Technical Analysts (STA London) diploma exam with distinction is a Certified Financial Technician (CFTe). Prior to TD Trader, he was the Chief Technical Analyst for Stockcharts.com and the main contributor to the ChartSchool.
PRINT THIS ARTICLE
WEDGE FORMATIONS
A Rising Wedge For The SOX
03/27/07 08:35:56 AMby Arthur Hill
The Semiconductor Index bounced with the rest of the market over the past few weeks, but the move looks like a bearish wedge.
Position: Hold
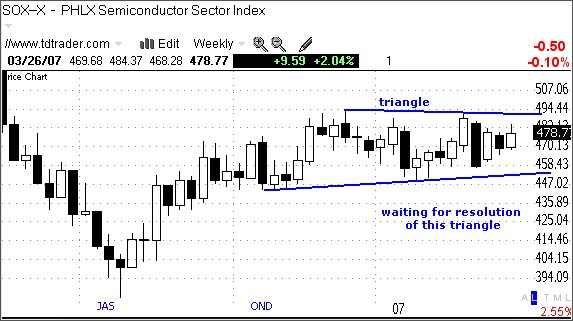
| Before looking at this wedge, it often helps to look at the long-term picture first. The Semiconductor Index ($SOX) advanced from July to November 2006 and then consolidated the last few months. The index reached 473 in mid-September 2006 and closed around 478 on March 26, 2007. That is a long time to be moving sideways, and it represents an extended consolidation or stalemate between bulls and bears. |

|
| FIGURE 1: $SOX, WEEKLY. The next long-term signal is dependent on the resolution of the pattern seen here. |
| Graphic provided by: Telechart 2007. |
| |
| The pattern at work on the weekly chart looks like a flat triangle (Figure 1). The trading range was narrow in the last quarter of 2006 and narrowed a little more in the first quarter of 2007. The next long-term signal is dependent on the resolution of this pattern. A break above 495 would be bullish and a break below 450 would be bearish. Until there is a breakout, traders must look to the swings within this triangle for signals. |
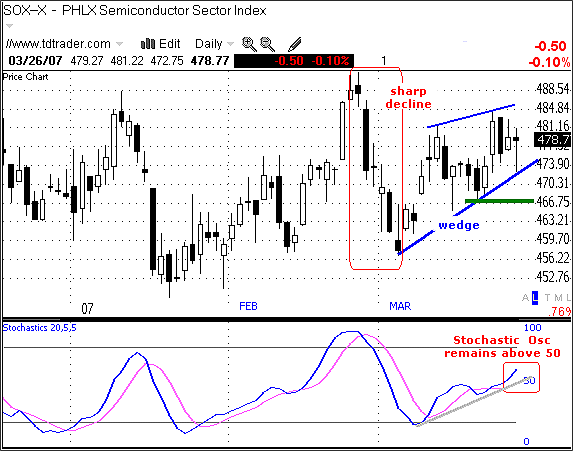
| I am turning to the daily chart (Figure 2) for swing signals within the triangle, and these signals have not been the easiest to catch. The current swing is up, but the index got hit hard at the end of February. This sharp decline was not quite enough to break the mid-February low, and the upswing held. The index rebounded in March, and this rebound looks like a rising wedge. The bulls have the edge as long as the wedge rises, but this pattern can be bearish and traders should watch price action closely over the next few days. |

|
| FIGURE 2: $SOX, DAILY. The sharp decline seen here was not quite enough to break the mid-February low, and the upswing held. |
| Graphic provided by: Telechart 2007. |
| |
| I am cueing off wedge supports and the stochastic oscillator for a potentially bearish signal. A break below the lower wedge trendline and support at 466 would break the rise of this wedge. This would signal a continuation of the prior decline and target a move below the January low. The stochastic oscillator is also moving higher, and I would wait for it to turn down before jumping on the bearish side. The indicator just moved above 50, and that is the threshold to watch. A move back below 50 would turn the stochastic oscillator down and this would confirm a wedge breakdown on the price chart. |
Arthur Hill is currently editor of TDTrader.com, a website specializing in trading strategies, sector/industry specific breadth stats and overall technical analysis. He passed the Society of Technical Analysts (STA London) diploma exam with distinction is a Certified Financial Technician (CFTe). Prior to TD Trader, he was the Chief Technical Analyst for Stockcharts.com and the main contributor to the ChartSchool.
| Title: | Editor |
| Company: | TDTrader.com |
| Address: | Willem Geetsstraat 17 |
| Mechelen, B2800 | |
| Phone # for sales: | 3215345465 |
| Website: | www.tdtrader.com |
| E-mail address: | arthurh@tdtrader.com |
Traders' Resource Links | |
| TDTrader.com has not added any product or service information to TRADERS' RESOURCE. | |
Click here for more information about our publications!
Comments
Date: 03/27/07Rank: 4Comment:

Request Information From Our Sponsors
- StockCharts.com, Inc.
- Candle Patterns
- Candlestick Charting Explained
- Intermarket Technical Analysis
- John Murphy on Chart Analysis
- John Murphy's Chart Pattern Recognition
- John Murphy's Market Message
- MurphyExplainsMarketAnalysis-Intermarket Analysis
- MurphyExplainsMarketAnalysis-Visual Analysis
- StockCharts.com
- Technical Analysis of the Financial Markets
- The Visual Investor
- VectorVest, Inc.
- Executive Premier Workshop
- One-Day Options Course
- OptionsPro
- Retirement Income Workshop
- Sure-Fire Trading Systems (VectorVest, Inc.)
- Trading as a Business Workshop
- VectorVest 7 EOD
- VectorVest 7 RealTime/IntraDay
- VectorVest AutoTester
- VectorVest Educational Services
- VectorVest OnLine
- VectorVest Options Analyzer
- VectorVest ProGraphics v6.0
- VectorVest ProTrader 7
- VectorVest RealTime Derby Tool
- VectorVest Simulator
- VectorVest Variator
- VectorVest Watchdog
