HOT TOPICS LIST
- MACD
- Fibonacci
- RSI
- Gann
- ADXR
- Stochastics
- Volume
- Triangles
- Futures
- Cycles
- Volatility
- ZIGZAG
- MESA
- Retracement
- Aroon
INDICATORS LIST
LIST OF TOPICS
PRINT THIS ARTICLE
by Arthur Hill
A gap up and MACD crossover point to higher prices for Tollgrade Communications.
Position: Accumulate
Arthur Hill
Arthur Hill is currently editor of TDTrader.com, a website specializing in trading strategies, sector/industry specific breadth stats and overall technical analysis. He passed the Society of Technical Analysts (STA London) diploma exam with distinction is a Certified Financial Technician (CFTe). Prior to TD Trader, he was the Chief Technical Analyst for Stockcharts.com and the main contributor to the ChartSchool.
PRINT THIS ARTICLE
BOLLINGER BANDS
Tollgrade Gaps Up
03/27/07 08:18:49 AMby Arthur Hill
A gap up and MACD crossover point to higher prices for Tollgrade Communications.
Position: Accumulate
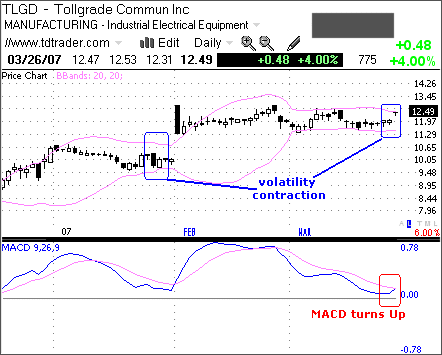
| Periods of reduced volatility are often followed by periods of increased volatility, and we can often anticipate a breakout by looking for periods of reduced volatility. Figure 1, the daily chart, shows Tollgrade (TLGD) with Bollinger Bands overlaid on the price plot. These reflect volatility, and the narrowing of the bands shows reduced volatility. The bands narrowed in January, and this preceded a breakout in early February. The current narrowing of the bands points to an impending volatility expansion, and the stock surged to the upper band with a gap up. This signals the beginning of a volatility expansion, and I am expecting a move. |

|
| FIGURE 1: TOLLGRADE, DAILY. The decline in MACD represents a correction of sorts and the recent upturn signals that the correction is over. |
| Graphic provided by: Telechart 2007. |
| |
| The gap up is bullish, and a bullish crossover in the moving average convergence/divergence (MACD) confirms this. The stock consolidated for two months and the MACD returned to the zero line in late March. The area just above the zero line also offered support in late January. The decline in the MACD represents a correction of sorts, and the recent upturn signals that the correction is over. The gap is a signal that the consolidation on the price chart has run its course. I would consider the gap bullish as long as it holds and a move back below support at 11.50 would be bearish. |

|
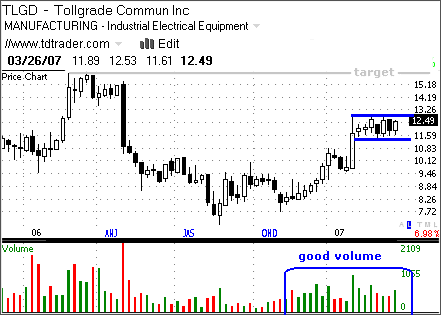
| FIGURE 2: TOLLGRADE, WEEKLY. A break above 12 would clear the air and target a move to the next resistance zone around 16. |
| Graphic provided by: Telechart 2007. |
| |
| I will turn to the weekly chart for an upside target (Figure 2). TLGD surged from August 2006 to January 2007 and then consolidated the last two months. The pattern looks like a flat flag and a break above the consolidation highs would signal a continuation higher. I find the gap on Figure 1 bullish, but Figure 2 still shows some resistance around 13. A break above 13 would clear the air and target a move to the next resistance zone around 16. It is also worth pointing out that upside volume has been above average in 2007, and this further reinforces strength in the advance. |
Arthur Hill is currently editor of TDTrader.com, a website specializing in trading strategies, sector/industry specific breadth stats and overall technical analysis. He passed the Society of Technical Analysts (STA London) diploma exam with distinction is a Certified Financial Technician (CFTe). Prior to TD Trader, he was the Chief Technical Analyst for Stockcharts.com and the main contributor to the ChartSchool.
| Title: | Editor |
| Company: | TDTrader.com |
| Address: | Willem Geetsstraat 17 |
| Mechelen, B2800 | |
| Phone # for sales: | 3215345465 |
| Website: | www.tdtrader.com |
| E-mail address: | arthurh@tdtrader.com |
Traders' Resource Links | |
| TDTrader.com has not added any product or service information to TRADERS' RESOURCE. | |
Click here for more information about our publications!
Comments
Date: 03/27/07Rank: 4Comment:

Request Information From Our Sponsors
- StockCharts.com, Inc.
- Candle Patterns
- Candlestick Charting Explained
- Intermarket Technical Analysis
- John Murphy on Chart Analysis
- John Murphy's Chart Pattern Recognition
- John Murphy's Market Message
- MurphyExplainsMarketAnalysis-Intermarket Analysis
- MurphyExplainsMarketAnalysis-Visual Analysis
- StockCharts.com
- Technical Analysis of the Financial Markets
- The Visual Investor
- VectorVest, Inc.
- Executive Premier Workshop
- One-Day Options Course
- OptionsPro
- Retirement Income Workshop
- Sure-Fire Trading Systems (VectorVest, Inc.)
- Trading as a Business Workshop
- VectorVest 7 EOD
- VectorVest 7 RealTime/IntraDay
- VectorVest AutoTester
- VectorVest Educational Services
- VectorVest OnLine
- VectorVest Options Analyzer
- VectorVest ProGraphics v6.0
- VectorVest ProTrader 7
- VectorVest RealTime Derby Tool
- VectorVest Simulator
- VectorVest Variator
- VectorVest Watchdog
