

HOT TOPICS LIST
- MACD
- Fibonacci
- RSI
- Gann
- ADXR
- Stochastics
- Volume
- Triangles
- Futures
- Cycles
- Volatility
- ZIGZAG
- MESA
- Retracement
- Aroon
INDICATORS LIST
LIST OF TOPICS
PRINT THIS ARTICLE
by Chaitali Mohile
RDWR is ready to give a bearish moving average crossover signal and also stand on the support, which when violated may lead to a downtrend.
Position: Sell
Chaitali Mohile
Active trader in the Indian stock markets since 2003 and a full-time writer. Trading is largely based upon technical analysis.
PRINT THIS ARTICLE
TECHNICAL ANALYSIS
Radware Stands On Crucial Support
03/28/07 10:43:22 AMby Chaitali Mohile
RDWR is ready to give a bearish moving average crossover signal and also stand on the support, which when violated may lead to a downtrend.
Position: Sell
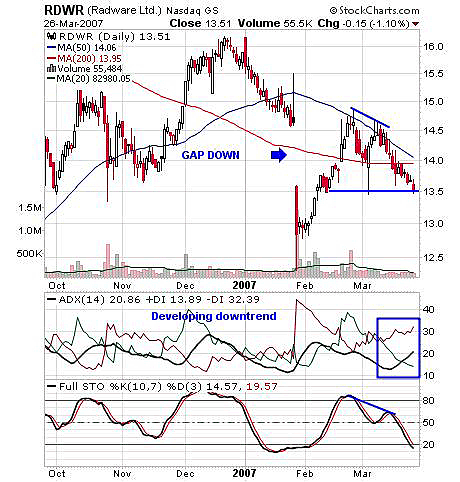
| Radware Ltd. (RDWR) is likely to enter a downtrend based on its daily and weekly charts. On the daily chart (Figure 1), the stock gapped down at the end of January. The traders then had an opportunity to take their capital as price recovered around $14.50. But due to a lack in volume, the stock made lower highs, indicating a poor rally. A 50-day moving average is also ready to cross a 200-day moving average downward, which is a bearish sign. Price usually follows the moving average, as can be seen in Figure 1. The price made lower highs but held its previous low. This low is its crucial support. |
|
| FIGURE 1: RDWR, DAILY. RDWR gapped down at the end of January 2007. |
| Graphic provided by: StockCharts.com. |
| |
| The stochastic sharply moved below 50. The average directional movement index (ADX)(14) shows increasing sellers' pressure and hence a developing bearish trend. |
| Traders can short the stock below $13.50 with a target of $12.50 on a daily basis. This short sell is recommended, as all the indicators are given bearish signals; $12.50 is the lower side support so keep an eye on it as the first target. |
|
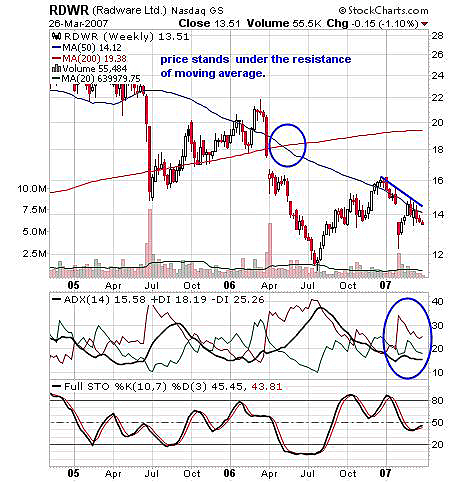
| FIGURE 2: RDWR, WEEKLY. The weekly chart has already made a bearish moving average crossover. |
| Graphic provided by: StockCharts.com. |
| |
| The weekly chart (Figure 2) has already made a bearish moving average crossover. The 200-day moving average has captured all the long side, resulting in more price depression. The pullback rally to $16 was hard to build before it finally moved to lower highs. In Figure 2, the price now faces two resistance levels of the 50-day moving average and the 200-day moving average. The ADX (14) on Figure 2 shows that bears took charge of the trend and thus the stock failed to perform. The stochastic (10,7,3) shows volatile moves whipsawing many traders. The stochastic made a double top as the price reached $16. The present level of the stochastic oscillator is no man's land. |
| The daily and weekly charts give a sell signal for Radware. The closest target is $12.50 and then a urther fall is possible. The graphs indicate possible downtrend. |
Active trader in the Indian stock markets since 2003 and a full-time writer. Trading is largely based upon technical analysis.
| Company: | Independent |
| Address: | C1/3 Parth Indraprasth Towers. Vastrapur |
| Ahmedabad, Guj 380015 | |
| E-mail address: | chaitalimohile@yahoo.co.in |
Traders' Resource Links | |
| Independent has not added any product or service information to TRADERS' RESOURCE. | |
Click here for more information about our publications!
Comments
Date:�03/29/07Rank:�4Comment:�

Request Information From Our Sponsors
- StockCharts.com, Inc.
- Candle Patterns
- Candlestick Charting Explained
- Intermarket Technical Analysis
- John Murphy on Chart Analysis
- John Murphy's Chart Pattern Recognition
- John Murphy's Market Message
- MurphyExplainsMarketAnalysis-Intermarket Analysis
- MurphyExplainsMarketAnalysis-Visual Analysis
- StockCharts.com
- Technical Analysis of the Financial Markets
- The Visual Investor
- VectorVest, Inc.
- Executive Premier Workshop
- One-Day Options Course
- OptionsPro
- Retirement Income Workshop
- Sure-Fire Trading Systems (VectorVest, Inc.)
- Trading as a Business Workshop
- VectorVest 7 EOD
- VectorVest 7 RealTime/IntraDay
- VectorVest AutoTester
- VectorVest Educational Services
- VectorVest OnLine
- VectorVest Options Analyzer
- VectorVest ProGraphics v6.0
- VectorVest ProTrader 7
- VectorVest RealTime Derby Tool
- VectorVest Simulator
- VectorVest Variator
- VectorVest Watchdog