HOT TOPICS LIST
- MACD
- Fibonacci
- RSI
- Gann
- ADXR
- Stochastics
- Volume
- Triangles
- Futures
- Cycles
- Volatility
- ZIGZAG
- MESA
- Retracement
- Aroon
INDICATORS LIST
LIST OF TOPICS
PRINT THIS ARTICLE
by Chaitali Mohile
WPZ made a new high with an overbought relative strength index. Some profit booking may be possible before the next bullish rally.
Position: N/A
Chaitali Mohile
Active trader in the Indian stock markets since 2003 and a full-time writer. Trading is largely based upon technical analysis.
PRINT THIS ARTICLE
RSI
Williams Partners May See Minor Dip
03/28/07 08:46:01 AMby Chaitali Mohile
WPZ made a new high with an overbought relative strength index. Some profit booking may be possible before the next bullish rally.
Position: N/A
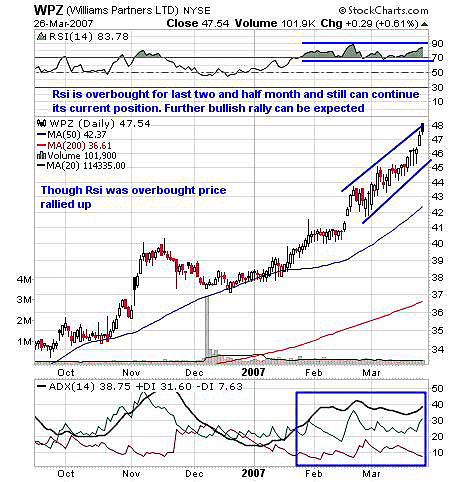
| The relative strength index (RSI) can carry its bullish rally on overbought positions. It can remain overbought/oversold for longer periods. Still, it can lead to a strong bullish price movement. On the daily chart (Figure 1), Williams Partners (WPZ) moved from $41 to $48 on an overbought RSI. During its upward move, the stock consolidated but the RSI remained overbought, not even moving below 70. This indicates the strength in rally and price movement too. |

|
| FIGURE 1: WPZ, DAILY. The overbought RSI carried the bullish rally . |
| Graphic provided by: StockCharts.com. |
| |
| The average directional movement index shows a strong bullish trend. As the price moved above the flag & pennant, the trend gave strong bullish support. The indicator has maintained above 30 so traders can expect the bullish trend to continue. The RSI is highly overbought at 83 so traders will see a mild dip to create additional space for an upward rally. The dip in the indicator can result in some consolidation or a much smaller correction. As a result, traders may choose to follow a strict stop-loss at $46 and carry the position. |

|
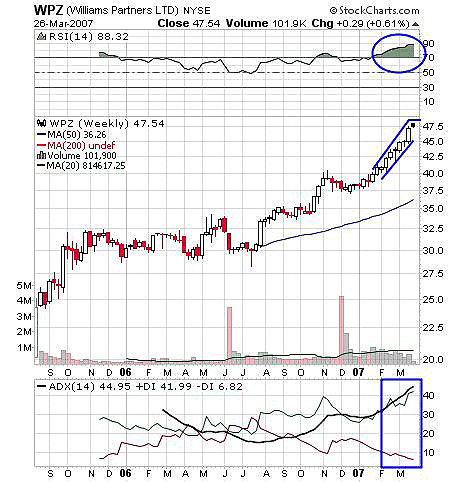
| FIGURE 2: WPZ, WEEKLY. Some consolidated move can be expected with an overbought RSI. |
| Graphic provided by: StockCharts.com. |
| |
| Figure 2 also shows a highly overbought RSI(14) at 88. A healthy bullish rally was followed on an overbought RSI without any alarming profit-booking rally. Looking at the current RSI, the stock can undergo some mild consolidation phase without losing profit on the previous rally. Traders just need to follow the strict stop-loss disclosed. |
| The ADX(14) above 40 is considered overheated, though it can move to 60 too. The weekly ADX(14) is 44 so traders can remain alert. On consolidation the stock on weekly chart (Figure 2) is likely to form a flag & pennant formation, which is again a continuation pattern in an uptrend. |
| Both charts give the same indication of consolidation or a minor dip. Traders should follow the stop-loss and enjoy the continuing bullish rally. |
Active trader in the Indian stock markets since 2003 and a full-time writer. Trading is largely based upon technical analysis.
| Company: | Independent |
| Address: | C1/3 Parth Indraprasth Towers. Vastrapur |
| Ahmedabad, Guj 380015 | |
| E-mail address: | chaitalimohile@yahoo.co.in |
Traders' Resource Links | |
| Independent has not added any product or service information to TRADERS' RESOURCE. | |
Click here for more information about our publications!
Comments
Date: 03/29/07Rank: 4Comment:

Request Information From Our Sponsors
- StockCharts.com, Inc.
- Candle Patterns
- Candlestick Charting Explained
- Intermarket Technical Analysis
- John Murphy on Chart Analysis
- John Murphy's Chart Pattern Recognition
- John Murphy's Market Message
- MurphyExplainsMarketAnalysis-Intermarket Analysis
- MurphyExplainsMarketAnalysis-Visual Analysis
- StockCharts.com
- Technical Analysis of the Financial Markets
- The Visual Investor
- VectorVest, Inc.
- Executive Premier Workshop
- One-Day Options Course
- OptionsPro
- Retirement Income Workshop
- Sure-Fire Trading Systems (VectorVest, Inc.)
- Trading as a Business Workshop
- VectorVest 7 EOD
- VectorVest 7 RealTime/IntraDay
- VectorVest AutoTester
- VectorVest Educational Services
- VectorVest OnLine
- VectorVest Options Analyzer
- VectorVest ProGraphics v6.0
- VectorVest ProTrader 7
- VectorVest RealTime Derby Tool
- VectorVest Simulator
- VectorVest Variator
- VectorVest Watchdog
