HOT TOPICS LIST
- MACD
- Fibonacci
- RSI
- Gann
- ADXR
- Stochastics
- Volume
- Triangles
- Futures
- Cycles
- Volatility
- ZIGZAG
- MESA
- Retracement
- Aroon
INDICATORS LIST
LIST OF TOPICS
PRINT THIS ARTICLE
by David Penn
Failure to follow through above the December 2006 highs provides an opportunity for correction or reversal in the EUR/USD.
Position: N/A
David Penn
Technical Writer for Technical Analysis of STOCKS & COMMODITIES magazine, Working-Money.com, and Traders.com Advantage.
PRINT THIS ARTICLE
REVERSAL
A 2B Top In The Euro?
03/27/07 10:00:39 AMby David Penn
Failure to follow through above the December 2006 highs provides an opportunity for correction or reversal in the EUR/USD.
Position: N/A
| I've been spending more and more time lately looking at foreign exchange charts. While often helpful in getting a broader understanding of what is going on in assets like gold and the US dollar, the forex markets themselves can be a great opportunity for traders in both the short and long term to profit using many of the same basic technical tools and strategies that work for stocks and other chartable markets. |

|
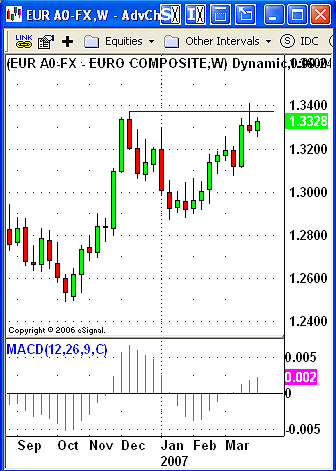
| FIGURE 1: EUR/USD, WEEKLY. The EUR/USD shows clearly the 2B top between the December 2006 and the March 2007 peaks. Failure to follow through beyond the new high created in March will make traders and speculators suspicious of the EUR/USD's ability to move higher in the near term, likely prompting bets to the short side. |
| Graphic provided by: eSignal. |
| |
| One of the methods I like to look for most frequently is one that works very well on just about every time frame I've tried it with: the 2B test. The 2B test is an excellent screen not only because it often captures the exact top or bottom of a given market, but also because the pattern itself helps traders and speculators see exactly where their risk lies. If you trade a 2B top, for example, and the market moves back up to set a new high, then you know it is time to exit. The same is true with a 2B bottom setup that goes on to record a new low. |
| 2B tests also work well with other indicators. Let a 2B test tell you that a market is reversing direction, and then let your favorite trend-following indicators — be they moving averages, trendlines, the moving average convergence/divergence (MACD) histogram, directional movement, and more — help you stay in the new trend. I like to confirm 2B tests whenever possible with an oscillator like the MACD histogram (the MACDH has both trend-following and overbought/oversold measuring capabilities, making it an ideal indicator for many situations). As I wrote in an article for Working-Money.com recently ("Breakouts, Pullbacks, And Gaming The 2B," January 24, 2007), the 2B test itself can be used to create a time stop to let you know how much time you should give a 2B test to start showing the makings of a winning setup before abandoning it for the next trade. |

|
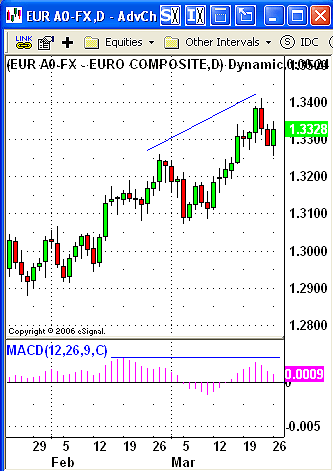
| FIGURE 2: EUR/USD, DAILY. In addition to the longer-term 2B top between the December 2006 peak in the euro and the March 2007 peak, the negative divergence in the MACD histogram that has developed between the late February and late March peaks is further confirmation that momentum to the upside is likely to wane in the near term. |
| Graphic provided by: eSignal. |
| |
| The 2B top in Figure 1, the weekly chart of the EUR/USD, so far represents an excellent example of this setup as it is likely to be spotted "in the wild." The EUR/USD made a high in December after rallying for a few months, then pulled back and began a scalloped, bowl-shaped correction that lasted into the spring of 2007. However, as prices rallied to test the December high — the other rim of the bowl — they retreated shortly after the new high was made. As soon as the retreat found the EUR/USD falling below the low of the December 2006 session that had featured the initial high, traders and speculators were all clear to bet against the EUR/USD moving higher in the near term. |
| The bearishness of this 2B top, as many are, is supported by the negative divergence in the MACD histogram. The MACD histogram features lower peaks in February and March (Figure 2), just as prices are making higher peaks. This, too, is a classic signal of a market that will have difficulty moving higher and that might be ripe for a reversal or correction to the downside. How much time should traders and speculators give the 2B top to play out profitably? Looking back to Figure 1, it appears as if the two peaks are separated by approximately 14 weeks. Based on the methodology presented in the Working-Money.com article I mentioned, this means that traders should be looking to preserve gains or at least limit losses by the seventh week after the pattern is complete. As far as targets go, the low between the February and March peaks, a low of about 1.3072 is one reasonable target, and would represent a 61.8% retracement of the EUR/USD advance from the early January 2007 low. |
Technical Writer for Technical Analysis of STOCKS & COMMODITIES magazine, Working-Money.com, and Traders.com Advantage.
| Title: | Technical Writer |
| Company: | Technical Analysis, Inc. |
| Address: | 4757 California Avenue SW |
| Seattle, WA 98116 | |
| Phone # for sales: | 206 938 0570 |
| Fax: | 206 938 1307 |
| Website: | www.Traders.com |
| E-mail address: | DPenn@traders.com |
Traders' Resource Links | |
| Charting the Stock Market: The Wyckoff Method -- Books | |
| Working-Money.com -- Online Trading Services | |
| Traders.com Advantage -- Online Trading Services | |
| Technical Analysis of Stocks & Commodities -- Publications and Newsletters | |
| Working Money, at Working-Money.com -- Publications and Newsletters | |
| Traders.com Advantage -- Publications and Newsletters | |
| Professional Traders Starter Kit -- Software | |
Click here for more information about our publications!
PRINT THIS ARTICLE

Request Information From Our Sponsors
- VectorVest, Inc.
- Executive Premier Workshop
- One-Day Options Course
- OptionsPro
- Retirement Income Workshop
- Sure-Fire Trading Systems (VectorVest, Inc.)
- Trading as a Business Workshop
- VectorVest 7 EOD
- VectorVest 7 RealTime/IntraDay
- VectorVest AutoTester
- VectorVest Educational Services
- VectorVest OnLine
- VectorVest Options Analyzer
- VectorVest ProGraphics v6.0
- VectorVest ProTrader 7
- VectorVest RealTime Derby Tool
- VectorVest Simulator
- VectorVest Variator
- VectorVest Watchdog
- StockCharts.com, Inc.
- Candle Patterns
- Candlestick Charting Explained
- Intermarket Technical Analysis
- John Murphy on Chart Analysis
- John Murphy's Chart Pattern Recognition
- John Murphy's Market Message
- MurphyExplainsMarketAnalysis-Intermarket Analysis
- MurphyExplainsMarketAnalysis-Visual Analysis
- StockCharts.com
- Technical Analysis of the Financial Markets
- The Visual Investor
