

HOT TOPICS LIST
- MACD
- Fibonacci
- RSI
- Gann
- ADXR
- Stochastics
- Volume
- Triangles
- Futures
- Cycles
- Volatility
- ZIGZAG
- MESA
- Retracement
- Aroon
INDICATORS LIST
LIST OF TOPICS
PRINT THIS ARTICLE
by Arthur Hill
THQ Inc formed an inverse head & shoulders over the last few months, and a break above neckline resistance would revitalize the uptrend.
Position: Accumulate
Arthur Hill
Arthur Hill is currently editor of TDTrader.com, a website specializing in trading strategies, sector/industry specific breadth stats and overall technical analysis. He passed the Society of Technical Analysts (STA London) diploma exam with distinction is a Certified Financial Technician (CFTe). Prior to TD Trader, he was the Chief Technical Analyst for Stockcharts.com and the main contributor to the ChartSchool.
PRINT THIS ARTICLE
HEAD & SHOULDERS
THQI Challenges Resistance
03/22/07 11:43:29 AMby Arthur Hill
THQ Inc formed an inverse head & shoulders over the last few months, and a break above neckline resistance would revitalize the uptrend.
Position: Accumulate
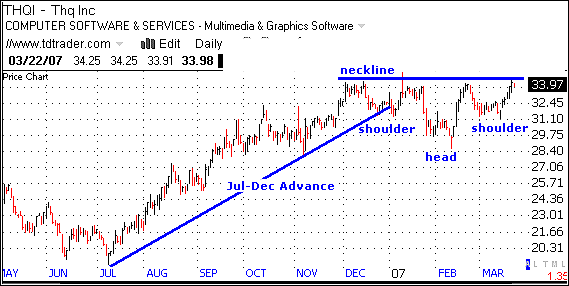
| There are two types of head & shoulders patterns: normal and inverse. A normal H&S pattern looks, well, like a normal H&S set. An inverse H&S pattern looks like an upside down H&S set. Once identified, the normal and inverse patterns can either be continuation patterns or reversal patterns. A continuation pattern signals an extension of the ongoing trend while a reversal pattern signals a trend change. |
|
| FIGURE 1: THQI, DAILY. The current pattern at work for this stock appears to be an inverse head & shoulders pattern. |
| Graphic provided by: Telechart 2007. |
| |
| The current pattern at work for THQI looks like a continuation inverse H&S pattern (Figure 1). The stock surged from July to early December, and this established the uptrend. A long consolidation period followed and THQI formed an inverse H&S. Neckline resistance resides around 34.6 and the stock is poised to break out. A move above would signal a continuation of the July-December advance and project further strength toward 40. |
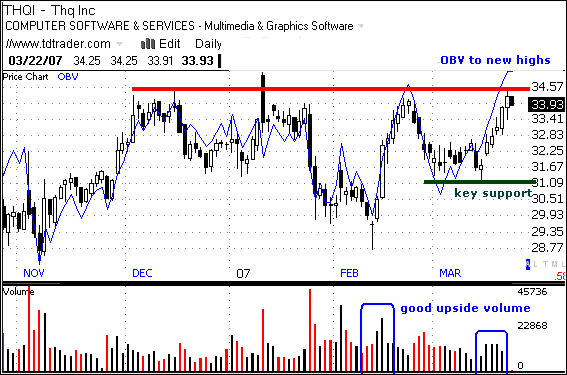
| Volume is an important part of a H&S pattern and good upside volume is required to confirm strength. Volume surged with the mid-February advance and the stock fell back in early March. There was another surge last week and volume was above average for three days. In addition, the on-balance volume (OBV) advanced to a new high this week, also confirming strong buying pressure. |
|
| FIGURE 2: THQI, DAILY. This stock appears poised to break out and move higher. |
| Graphic provided by: Telechart 2007. |
| |
| The stock looks poised to break out and move higher, but we should also prepare for the possibility of a failure. The stock established support around 31 in late February and early March (Figure 2). In addition, there was a gap up on March 15, and this gap should hold. A move below 31 would fill the gap, break key support, and reverse the current uptrend. |
Arthur Hill is currently editor of TDTrader.com, a website specializing in trading strategies, sector/industry specific breadth stats and overall technical analysis. He passed the Society of Technical Analysts (STA London) diploma exam with distinction is a Certified Financial Technician (CFTe). Prior to TD Trader, he was the Chief Technical Analyst for Stockcharts.com and the main contributor to the ChartSchool.
| Title: | Editor |
| Company: | TDTrader.com |
| Address: | Willem Geetsstraat 17 |
| Mechelen, B2800 | |
| Phone # for sales: | 3215345465 |
| Website: | www.tdtrader.com |
| E-mail address: | arthurh@tdtrader.com |
Traders' Resource Links | |
| TDTrader.com has not added any product or service information to TRADERS' RESOURCE. | |
Click here for more information about our publications!
Comments
Date:�03/22/07Rank:�4Comment:�

Request Information From Our Sponsors
- StockCharts.com, Inc.
- Candle Patterns
- Candlestick Charting Explained
- Intermarket Technical Analysis
- John Murphy on Chart Analysis
- John Murphy's Chart Pattern Recognition
- John Murphy's Market Message
- MurphyExplainsMarketAnalysis-Intermarket Analysis
- MurphyExplainsMarketAnalysis-Visual Analysis
- StockCharts.com
- Technical Analysis of the Financial Markets
- The Visual Investor
- VectorVest, Inc.
- Executive Premier Workshop
- One-Day Options Course
- OptionsPro
- Retirement Income Workshop
- Sure-Fire Trading Systems (VectorVest, Inc.)
- Trading as a Business Workshop
- VectorVest 7 EOD
- VectorVest 7 RealTime/IntraDay
- VectorVest AutoTester
- VectorVest Educational Services
- VectorVest OnLine
- VectorVest Options Analyzer
- VectorVest ProGraphics v6.0
- VectorVest ProTrader 7
- VectorVest RealTime Derby Tool
- VectorVest Simulator
- VectorVest Variator
- VectorVest Watchdog