HOT TOPICS LIST
- MACD
- Fibonacci
- RSI
- Gann
- ADXR
- Stochastics
- Volume
- Triangles
- Futures
- Cycles
- Volatility
- ZIGZAG
- MESA
- Retracement
- Aroon
INDICATORS LIST
LIST OF TOPICS
PRINT THIS ARTICLE
by Chaitali Mohile
A double top on Digene Corp.'s weekly chart may change the stock's trend.
Position: N/A
Chaitali Mohile
Active trader in the Indian stock markets since 2003 and a full-time writer. Trading is largely based upon technical analysis.
PRINT THIS ARTICLE
DOUBLE TOPS
Digene Takes A Nose-Dive
03/23/07 02:50:19 PMby Chaitali Mohile
A double top on Digene Corp.'s weekly chart may change the stock's trend.
Position: N/A
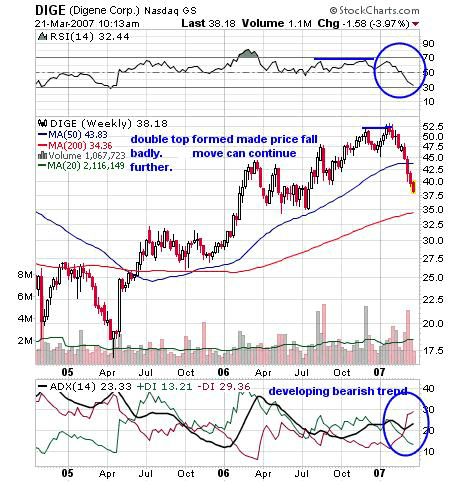
| Digene Corp. (DIGE) formed a double top, with the first top in December 2006 at $52.50 and the second top in February 2007 at about the same level. These tops have a moderate valley at $47.50 in between. This double top can bring intermediate change in the uptrend. But this change can be confirmed only by violating the support of the trough in between the two peaks. The price can even react from the support and run toward the high-forming third consecutive peak. In such case, a double-top formation fails. So traders need to be patient till the support of the trough is crossed downward. |
| A double-top pattern failure is rare, but precaution is better. Figure 1 shows Digene (DIGE) corrected faster on crossing the $45 support of the trough; $45 holds another importance, as it coincides with the 50-day moving average (MA). The stock plunged hard below this support, opening fresh short positions. The lowest the support can be held is the 200-day MA, so this level can be the target for short positions. Traders can also correlate this support with the relative strength index (RSI)(14) to get safe entry for a short. |

|
| FIGURE 1 DIGE, WEEKLY. A double top can lead to more weakness in the stock. The 200-day moving average is the next lowest support. |
| Graphic provided by: StockCharts.com. |
| |
| The RSI(14) in Figure 1 formed a lower high when price made a second peak at $52.50. This might be seen as a negative divergence to price. The RSI(14) then started its downward journey. At 50 the indicator and the 50-day MA correlated. Traders looking to short the stock could get in as the RSI moves below 50. And Figure 1, a weekly chart, also shows a similar increase in sellers' side as all three supports were taken out. |
| The average directional movement index (ADX)(14), a trend indicator, points to a temporary change in uptrend as the price of DIGE began its down trip and more sellers came in. When the double top was getting formed, the positive directional index (+DI) moved below the ADX and the -DI crossed above. This indicates bears were in charge of the trend. |
| Thus, the double top can be traded successfully, considering certain conditions. Good short trades are possible in individual stocks. With a double top in DIGE, many successful traders must have taken short positions as well. The lowest 200-day moving average support level may decide further action in Digene Corp. |
Active trader in the Indian stock markets since 2003 and a full-time writer. Trading is largely based upon technical analysis.
| Company: | Independent |
| Address: | C1/3 Parth Indraprasth Towers. Vastrapur |
| Ahmedabad, Guj 380015 | |
| E-mail address: | chaitalimohile@yahoo.co.in |
Traders' Resource Links | |
| Independent has not added any product or service information to TRADERS' RESOURCE. | |
Click here for more information about our publications!
Comments
Date: 03/23/07Rank: 4Comment:

Request Information From Our Sponsors
- VectorVest, Inc.
- Executive Premier Workshop
- One-Day Options Course
- OptionsPro
- Retirement Income Workshop
- Sure-Fire Trading Systems (VectorVest, Inc.)
- Trading as a Business Workshop
- VectorVest 7 EOD
- VectorVest 7 RealTime/IntraDay
- VectorVest AutoTester
- VectorVest Educational Services
- VectorVest OnLine
- VectorVest Options Analyzer
- VectorVest ProGraphics v6.0
- VectorVest ProTrader 7
- VectorVest RealTime Derby Tool
- VectorVest Simulator
- VectorVest Variator
- VectorVest Watchdog
- StockCharts.com, Inc.
- Candle Patterns
- Candlestick Charting Explained
- Intermarket Technical Analysis
- John Murphy on Chart Analysis
- John Murphy's Chart Pattern Recognition
- John Murphy's Market Message
- MurphyExplainsMarketAnalysis-Intermarket Analysis
- MurphyExplainsMarketAnalysis-Visual Analysis
- StockCharts.com
- Technical Analysis of the Financial Markets
- The Visual Investor
