HOT TOPICS LIST
- MACD
- Fibonacci
- RSI
- Gann
- ADXR
- Stochastics
- Volume
- Triangles
- Futures
- Cycles
- Volatility
- ZIGZAG
- MESA
- Retracement
- Aroon
INDICATORS LIST
LIST OF TOPICS
PRINT THIS ARTICLE
by David Penn
Will corn futures ever correct?
Position: N/A
David Penn
Technical Writer for Technical Analysis of STOCKS & COMMODITIES magazine, Working-Money.com, and Traders.com Advantage.
PRINT THIS ARTICLE
SEASONAL TRADING
King Corn
03/21/07 11:08:53 AMby David Penn
Will corn futures ever correct?
Position: N/A
| I've held back from writing about corn futures. This is mostly because there didn't seem to be much to say about corn other than "still going up" for the past several months going back to early 2006. Corn, basis continuous futures, bottomed in November 2005 below $2, and a year and a half later, the price of corn has more than doubled, climbing above $4.50 in February 2007. The rally in corn truly accelerated after a short pullback in summer 2006. From a September bottom near $2.40, corn moved virtually straight up for nearly six months. Corn, like most commodities, displays a few seasonal tendencies. The most powerful of these, based on the price action of corn from 1987 to 2005, is a seasonal decline in corn prices starting in April and ending in the late summer. Writing in the Commodity Trader's Almanac, Scott Barrie notes plainly: "April is a weak month for July corn." |

|
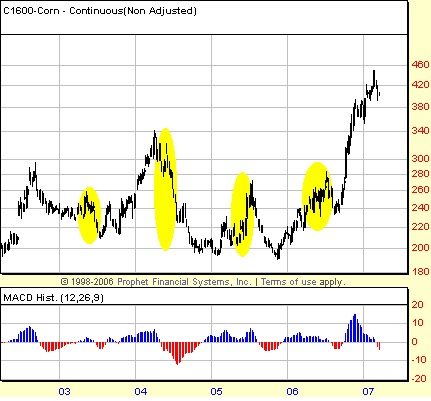
| FIGURE 1: CORN, CONTINUOUS FUTURES, WEEKLY. Of the recent April–July periods, the ones in 2003 and 2004 were typically bearish. The moves in 2005 and 2006, however, were bullish. Does the run in late 2006 and into 2007 suggest that April 2007 will mark a top in this overextended market? |
| Graphic provided by: Prophet Financial, Inc. |
| |
| Over the past few years, this April-to-July time frame has produced both bearish and bullish episodes for corn prices. The years 2003 and 2004 were, as seasonality would suggest, bearish (Figure 1); 2005 and 2006, however, were bullish. The 2006 April-to-July correction was especially interesting insofar as it was not only bullish but also served as the prelude to a major push higher in corn prices (as opposed to the 2005 rally, which only led to new lows when it did correct in late July). |
| Given the fact that corn has bucked the April-to-July seasonal decline two years in a row, should traders suspect that corn is more or less likely to experience an April-to-July decline in 2007? The last time corn enjoyed a bull market of these proportions was in the mid-1990s, when the price of corn (basis continuous futures) rallied from $2.11 in November 1994 to more than $4.50 in April 1996. A major correction followed, taking corn to new lows by the summer of 1998. |

|
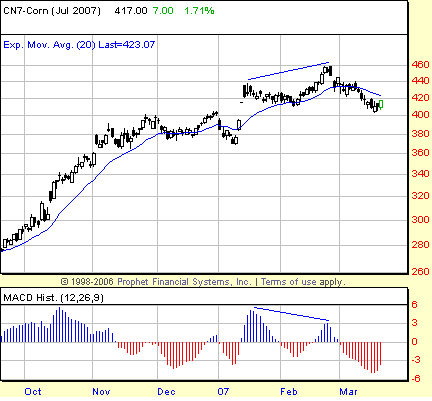
| FIGURE 2: CORN, JULY FUTURES, DAILY. A negative divergence in the MACD histogram between the peak in January and the peak in February helped traders anticipate the correction that developed in March. |
| Graphic provided by: Prophet Financial, Inc. |
| |
| There is a saying that markets can remain irrational for longer than most speculators can remain solvent. The market for corn over the past few months seems to be a textbook example of this maxim at work. While it is impossible for corn prices to continue rallying "to the moon," it is hard to imagine the courage or foolhardiness necessary to stand in the way of corn's advance, expecting it to reverse. |
| All that said, corn has begun to display some of the tells that often presage significant corrections. Chief among these signs is the negative divergence between the consecutively higher peaks in price from January to February and the consecutively lower peaks in the MACD histogram over the same period (Figure 2). July corn has lost some 50-odd cents since the February peak, though it has found some support at the level of the gap up from back in mid-January. In addition, there is more potential support between $4 and $3.80 from the November–December 2006 price consolidation. If this support holds, then it is likely that any further correction will likely be more sideways than sharply lower. If this support does not hold — as seasonality tends to suggest — then there is precious little between the support in the $3.80 area and potential support at the $2.80 level. |
Technical Writer for Technical Analysis of STOCKS & COMMODITIES magazine, Working-Money.com, and Traders.com Advantage.
| Title: | Technical Writer |
| Company: | Technical Analysis, Inc. |
| Address: | 4757 California Avenue SW |
| Seattle, WA 98116 | |
| Phone # for sales: | 206 938 0570 |
| Fax: | 206 938 1307 |
| Website: | www.Traders.com |
| E-mail address: | DPenn@traders.com |
Traders' Resource Links | |
| Charting the Stock Market: The Wyckoff Method -- Books | |
| Working-Money.com -- Online Trading Services | |
| Traders.com Advantage -- Online Trading Services | |
| Technical Analysis of Stocks & Commodities -- Publications and Newsletters | |
| Working Money, at Working-Money.com -- Publications and Newsletters | |
| Traders.com Advantage -- Publications and Newsletters | |
| Professional Traders Starter Kit -- Software | |
Click here for more information about our publications!
Comments
Date: 03/22/07Rank: 2Comment:

Request Information From Our Sponsors
- StockCharts.com, Inc.
- Candle Patterns
- Candlestick Charting Explained
- Intermarket Technical Analysis
- John Murphy on Chart Analysis
- John Murphy's Chart Pattern Recognition
- John Murphy's Market Message
- MurphyExplainsMarketAnalysis-Intermarket Analysis
- MurphyExplainsMarketAnalysis-Visual Analysis
- StockCharts.com
- Technical Analysis of the Financial Markets
- The Visual Investor
- VectorVest, Inc.
- Executive Premier Workshop
- One-Day Options Course
- OptionsPro
- Retirement Income Workshop
- Sure-Fire Trading Systems (VectorVest, Inc.)
- Trading as a Business Workshop
- VectorVest 7 EOD
- VectorVest 7 RealTime/IntraDay
- VectorVest AutoTester
- VectorVest Educational Services
- VectorVest OnLine
- VectorVest Options Analyzer
- VectorVest ProGraphics v6.0
- VectorVest ProTrader 7
- VectorVest RealTime Derby Tool
- VectorVest Simulator
- VectorVest Variator
- VectorVest Watchdog
