HOT TOPICS LIST
- MACD
- Fibonacci
- RSI
- Gann
- ADXR
- Stochastics
- Volume
- Triangles
- Futures
- Cycles
- Volatility
- ZIGZAG
- MESA
- Retracement
- Aroon
INDICATORS LIST
LIST OF TOPICS
PRINT THIS ARTICLE
by David Penn
After putting in a seasonal bottom in October, cocoa futures continue to ramp higher into March.
Position: N/A
David Penn
Technical Writer for Technical Analysis of STOCKS & COMMODITIES magazine, Working-Money.com, and Traders.com Advantage.
PRINT THIS ARTICLE
SEASONAL TRADING
Cocoa's Spring Offensive
03/20/07 12:33:40 PMby David Penn
After putting in a seasonal bottom in October, cocoa futures continue to ramp higher into March.
Position: N/A
| While there are a number of swing trading approaches that work very well with commodities, it cannot be denied that an awareness of seasonal tendencies in the commodities can be a great benefit to anyone looking to trade them, short term or long. Seasonal tendencies can help put a bull market, bear market, or sideways consolidation into the sort of perspective that can make it easier for a trader to pursue or abandon a trade that might seem to have a poor risk/reward when viewed from the chart alone. |

|
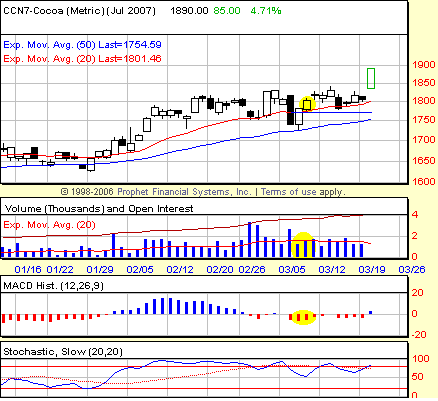
| FIGURE 1: COCOA, JULY FUTURES, DAILY. The P-p-P pattern in the MACD histogram in early March sets up a swing buy in July cocoa. The blue horizontal line represents the stop-loss level — equal to the low of the session during which the P-p-P was completed. Note also the increase in volume. |
| Graphic provided by: Prophet Financial, Inc. |
| |
| Here's an example. The moving average convergence/divergence (MACD) histogram can be used to set up swing trades by looking for instances when a market pulls back to support (that is, past price support, trendlines, moving averages) and the MACD histogram makes either a P-p-P or M-m-M pattern (see my Working Money articles, "Trading the Histogram," Parts I and II, for more on the MACDH). Looking back over the past six months in July cocoa, there were a number of opportunities to make this sort of trade. The most recent one occurred on March 8 after CCN7 had pulled back to the 50-day exponential moving average (EMA) and then bounced higher. With an entry at about 1825.50 and a stop somewhere between 1780 (a $500 per contract stop) and 1773 (the low of the March 8th session when the P-p-P pattern was completed), a cocoa trader would have enjoyed a gap up breakout on March 20 into which at least a portion of the profitable trade could have been sold. See Figures 1 and 2. No sentiment, no seasonals — nothing but the chart and the indicators. |
| Will there be further long-side swing trades in cocoa? By considering some of the seasonal factors in cocoa — and looking at long-term charts — we can get some sense of where cocoa might be headed and when. This can help a trader adjust his or her expectations as potentially significant seasonal turning points draw near. |

|
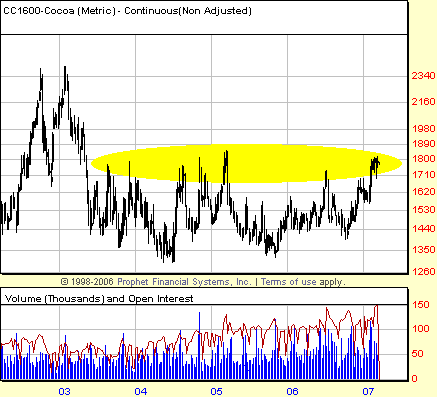
| FIGURE 2: COCOA, CONTINUOUS FUTURES, WEEKLY. The range between 1700 and 1800 has provided effective resistance to rallies in cocoa for the past three years. |
| Graphic provided by: Prophet Financial, Inc. |
| |
| Cocoa has some interesting historical trends. The commodity tends to bottom in October, according to Scott Barrie's Commodity Trader's Handbook, which is the beginning of harvest season. The market for cocoa often shows strength into the summer months — particularly July — which is a "between mid-crop and main-crop" harvest time. Barrie also suggests that the rally from the October lows can be a powerful one. Only in January has cocoa shown a higher dollar per ton monthly performance since 1987 than in November. |

|
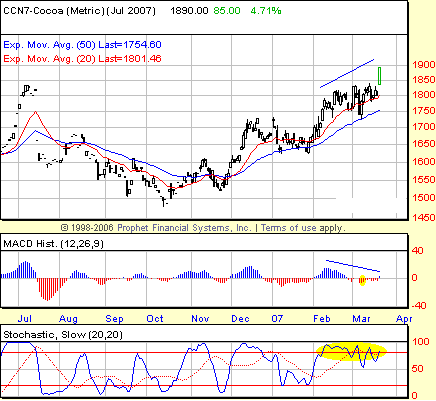
| FIGURE 3: COCOA, JULY FUTURES, DAILY. Negative divergences build in both the MACD histogram and the stochastic as cocoa pushes toward new highs. |
| Graphic provided by: Prophet Financial, Inc. |
| |
| How can those trading cocoa factor this into their planning? Barrie points out another potential turning point, in April, when cocoa historically (at least since 1987) has shown a tendency to sell off (only in September and October does cocoa fare worse). Given the strength in cocoa since bottoming in mid-October 2006, traders who are long cocoa should be wary for the possibility of a reversal should negative divergences begin to appear. See Figure 3. |
Technical Writer for Technical Analysis of STOCKS & COMMODITIES magazine, Working-Money.com, and Traders.com Advantage.
| Title: | Technical Writer |
| Company: | Technical Analysis, Inc. |
| Address: | 4757 California Avenue SW |
| Seattle, WA 98116 | |
| Phone # for sales: | 206 938 0570 |
| Fax: | 206 938 1307 |
| Website: | www.Traders.com |
| E-mail address: | DPenn@traders.com |
Traders' Resource Links | |
| Charting the Stock Market: The Wyckoff Method -- Books | |
| Working-Money.com -- Online Trading Services | |
| Traders.com Advantage -- Online Trading Services | |
| Technical Analysis of Stocks & Commodities -- Publications and Newsletters | |
| Working Money, at Working-Money.com -- Publications and Newsletters | |
| Traders.com Advantage -- Publications and Newsletters | |
| Professional Traders Starter Kit -- Software | |
Click here for more information about our publications!
Comments
Date: 03/20/07Rank: 2Comment:

Request Information From Our Sponsors
- VectorVest, Inc.
- Executive Premier Workshop
- One-Day Options Course
- OptionsPro
- Retirement Income Workshop
- Sure-Fire Trading Systems (VectorVest, Inc.)
- Trading as a Business Workshop
- VectorVest 7 EOD
- VectorVest 7 RealTime/IntraDay
- VectorVest AutoTester
- VectorVest Educational Services
- VectorVest OnLine
- VectorVest Options Analyzer
- VectorVest ProGraphics v6.0
- VectorVest ProTrader 7
- VectorVest RealTime Derby Tool
- VectorVest Simulator
- VectorVest Variator
- VectorVest Watchdog
- StockCharts.com, Inc.
- Candle Patterns
- Candlestick Charting Explained
- Intermarket Technical Analysis
- John Murphy on Chart Analysis
- John Murphy's Chart Pattern Recognition
- John Murphy's Market Message
- MurphyExplainsMarketAnalysis-Intermarket Analysis
- MurphyExplainsMarketAnalysis-Visual Analysis
- StockCharts.com
- Technical Analysis of the Financial Markets
- The Visual Investor
