HOT TOPICS LIST
- MACD
- Fibonacci
- RSI
- Gann
- ADXR
- Stochastics
- Volume
- Triangles
- Futures
- Cycles
- Volatility
- ZIGZAG
- MESA
- Retracement
- Aroon
INDICATORS LIST
LIST OF TOPICS
PRINT THIS ARTICLE
by Austin Passamonte
Is there a trend bias in weekly chart views?
Position: Sell
Austin Passamonte
Austin is a private trader who trades emini stock index futures intraday. He currently trades various futures markets from home in addition to managing a trader's educational forum
PRINT THIS ARTICLE
TECHNICAL ANALYSIS
Fed Up?
03/20/07 09:11:51 AMby Austin Passamonte
Is there a trend bias in weekly chart views?
Position: Sell
| Since the broad market plunge on February 27, traders and investors have been seeking bottoms at every turn. Have the major indexes printed recent lows that will last, or is this period just a pause that refreshes the sellers? |

|
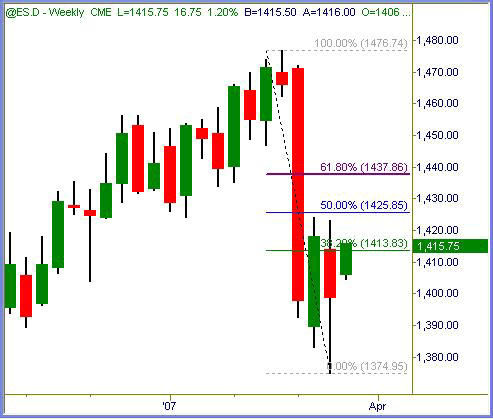
| FIGURE 1: S&P 500 FUTURES, WEEKLY. Common retracement levels are followed by literally thousands of traders, with prestaged stop orders to buy or sell clustered around each level. |
| Graphic provided by: TradeStation. |
| |
| For the past two weeks, measuring price action from recent highs through subsequent lows sees each lift stall out at the 38% retracement level. That magnet is currently 1414 in the ES contract, with 1425 and then 1438 the next widely watched lines of demarcation (Figure 1). These common retracement levels are followed by literally thousands of traders, with prestaged stop orders to buy or sell clustered around each level right now. |

|
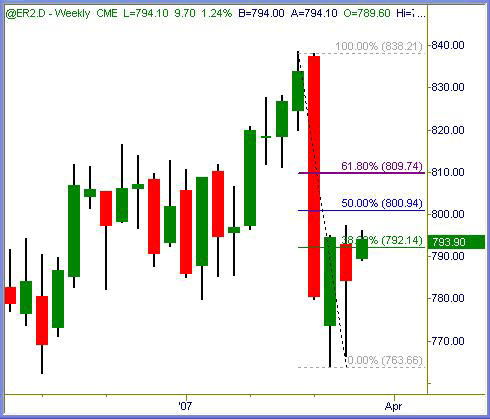
| FIGURE 2: RUSSELL 2000 FUTURES, WEEKLY. The Russell 2000 levels will see sellers pressing first tests of each mark if and when price action gets there before dropping further first. |
| Graphic provided by: TradeStation. |
| |
| Russell 2000 levels at 801 and 810 areas will see sellers pressing first tests of each mark if/when price action gets there before dropping further first. We can see where the 794 zone has topped out recent upside attempts prior to now. See Figure 2. |
| Should price action close above the 62% values on a weekly basis, most sellers would cover as buyers step in to wrest control. If the recent trend lower still has plenty of strength, expect 50% retracement to hold high water. It's possible price action could chop sideways inside these grid values, but plenty of market catalysts are straight ahead this week to shake, shock, and awe stock index markets. |
| Retracement grids are one of the most widely used measures of pending market action. Keeping one eye on the weekly chart and where price action is on the scale tells a lot about current and pending trend action ahead. |
Austin is a private trader who trades emini stock index futures intraday. He currently trades various futures markets from home in addition to managing a trader's educational forum
| Title: | Individual Trader |
| Company: | CoiledMarkets.com |
| Address: | PO Box 633 |
| Naples, NY 14512 | |
| Website: | coiledmarkets.com/blog |
| E-mail address: | austinp44@yahoo.com |
Traders' Resource Links | |
| CoiledMarkets.com has not added any product or service information to TRADERS' RESOURCE. | |
Click here for more information about our publications!
Comments
Date: 03/20/07Rank: 3Comment:

Request Information From Our Sponsors
- StockCharts.com, Inc.
- Candle Patterns
- Candlestick Charting Explained
- Intermarket Technical Analysis
- John Murphy on Chart Analysis
- John Murphy's Chart Pattern Recognition
- John Murphy's Market Message
- MurphyExplainsMarketAnalysis-Intermarket Analysis
- MurphyExplainsMarketAnalysis-Visual Analysis
- StockCharts.com
- Technical Analysis of the Financial Markets
- The Visual Investor
- VectorVest, Inc.
- Executive Premier Workshop
- One-Day Options Course
- OptionsPro
- Retirement Income Workshop
- Sure-Fire Trading Systems (VectorVest, Inc.)
- Trading as a Business Workshop
- VectorVest 7 EOD
- VectorVest 7 RealTime/IntraDay
- VectorVest AutoTester
- VectorVest Educational Services
- VectorVest OnLine
- VectorVest Options Analyzer
- VectorVest ProGraphics v6.0
- VectorVest ProTrader 7
- VectorVest RealTime Derby Tool
- VectorVest Simulator
- VectorVest Variator
- VectorVest Watchdog
