

HOT TOPICS LIST
- MACD
- Fibonacci
- RSI
- Gann
- ADXR
- Stochastics
- Volume
- Triangles
- Futures
- Cycles
- Volatility
- ZIGZAG
- MESA
- Retracement
- Aroon
INDICATORS LIST
LIST OF TOPICS
PRINT THIS ARTICLE
by Koos van der Merwe
Whereas my long-term view for gold is not that positive, my short-term forecast is very positive. What do I mean by long term and what do I mean by short term?
Position: Buy
Koos van der Merwe
Has been a technical analyst since 1969, and has worked as a futures and options trader with First Financial Futures in Johannesburg, South Africa.
PRINT THIS ARTICLE
ELLIOTT WAVE
The Long And The Short Of Gold?
03/20/07 09:02:17 AMby Koos van der Merwe
Whereas my long-term view for gold is not that positive, my short-term forecast is very positive. What do I mean by long term and what do I mean by short term?
Position: Buy
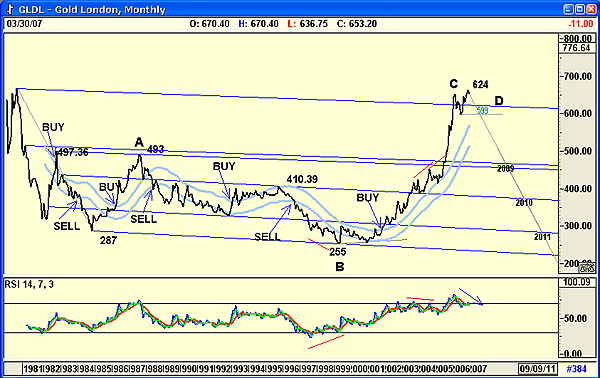
| Many years ago, I was discussing the economy of South Africa with the then-finance minister of South Africa, Barend du Plessis. We couldn't agree on anything. My long-term charts were telling me that gold would start recovering and start moving up, and du Plessis kept insisting that for the long term, gold would remain at its present $286 per ounce level. This was in 1985 and gold had bottomed at $287 (Figure 1). After further discussion, the realization struck me. "Define your long term," I said. "Fifteen years," he replied. "My long term," I answered, "is two to three years." |
|
| FIGURE 1: LONDON GOLD, MONTHLY. Here, London gold is suggesting negativity over the long term. |
| Graphic provided by: AdvancedGET. |
| |
| My long-term chart is still showing that gold is on the way down, and I am talking about the next two years (Figure 1). I have marked off what could be support levels on the chart with the price target for gold. The indicator, a simple 14-period relative strength index (RSI), is overbought and suggesting a downtrend. |
|
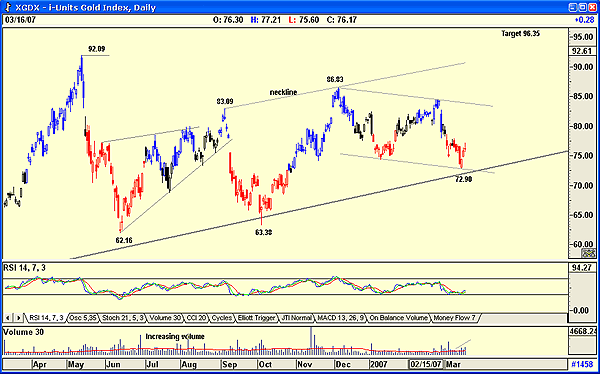
| FIGURE 2: TORONTO I-SHARE GOLD INDEX, DAILY. For the short term, this looks strong, but for the long term, gold does not. |
| Graphic provided by: AdvancedGET. |
| |
| For the short term, however, I have chosen the Gold Index i-Share quoted on the Toronto Stock Exchange rather than gold itself. This is because the i-Share, although tracking the gold price, does include a degree of investor sentiment. |
| Figure 2 shows how the i-Share fell from a high of Canadian $92.09 to Canadian $62.16. It then formed a pennant pattern, which suggested a target of Canadian $53.16. (92.09 - 62.16 = 29.93. 83.09 - 29.93 = 53.10.) The i-Share did not fall to the target level, but found strong support on the long-term trendline drawn from 2005 at C$63.38. From this level, the price has risen to C$86.83 before falling back in a flag pattern. This pattern suggests a target of C$96.35. (86.83-63.38 = 23.45. 72.90 + 23.45 = 96.35.) The RSI is also oversold and suggesting a rise. Volume is also increasing as the price rises — a bullish sign. For the short term, and I am talking three months, the indication is to buy the i-Share, but be careful for the long term, as my analysis suggests that the next two years still looks negative for gold. |
Has been a technical analyst since 1969, and has worked as a futures and options trader with First Financial Futures in Johannesburg, South Africa.
| Address: | 3256 West 24th Ave |
| Vancouver, BC | |
| Phone # for sales: | 6042634214 |
| E-mail address: | petroosp@gmail.com |
Click here for more information about our publications!
Comments
Date:�03/20/07Rank:�3Comment:�

Request Information From Our Sponsors
- StockCharts.com, Inc.
- Candle Patterns
- Candlestick Charting Explained
- Intermarket Technical Analysis
- John Murphy on Chart Analysis
- John Murphy's Chart Pattern Recognition
- John Murphy's Market Message
- MurphyExplainsMarketAnalysis-Intermarket Analysis
- MurphyExplainsMarketAnalysis-Visual Analysis
- StockCharts.com
- Technical Analysis of the Financial Markets
- The Visual Investor
- VectorVest, Inc.
- Executive Premier Workshop
- One-Day Options Course
- OptionsPro
- Retirement Income Workshop
- Sure-Fire Trading Systems (VectorVest, Inc.)
- Trading as a Business Workshop
- VectorVest 7 EOD
- VectorVest 7 RealTime/IntraDay
- VectorVest AutoTester
- VectorVest Educational Services
- VectorVest OnLine
- VectorVest Options Analyzer
- VectorVest ProGraphics v6.0
- VectorVest ProTrader 7
- VectorVest RealTime Derby Tool
- VectorVest Simulator
- VectorVest Variator
- VectorVest Watchdog