HOT TOPICS LIST
- MACD
- Fibonacci
- RSI
- Gann
- ADXR
- Stochastics
- Volume
- Triangles
- Futures
- Cycles
- Volatility
- ZIGZAG
- MESA
- Retracement
- Aroon
INDICATORS LIST
LIST OF TOPICS
PRINT THIS ARTICLE
by David Penn
Will sugar find a bottom in springtime?
Position: N/A
David Penn
Technical Writer for Technical Analysis of STOCKS & COMMODITIES magazine, Working-Money.com, and Traders.com Advantage.
PRINT THIS ARTICLE
SEASONAL TRADING
The Sweet Suffering Of Sugar
03/16/07 03:52:30 PMby David Penn
Will sugar find a bottom in springtime?
Position: N/A
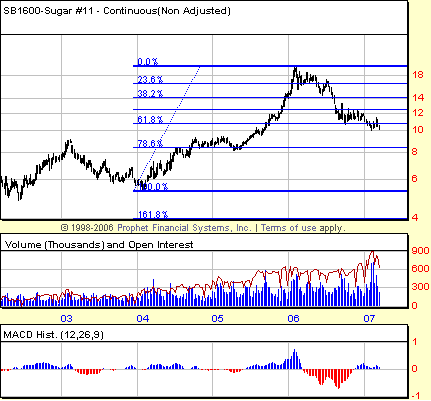
When I last wrote about sugar for Traders.com Advantage ("The Sugar Triangle," August 25, 2006), the commodity had broken down severely from a symmetrical triangle in May 2006. With sugar prices still in free fall, I wrote in August:... As far as the minimum downside projection in sugar is concerned, mission accomplished. At this point, sugar has retraced just a bit more than 50% of its rally from the February 2004 lows. A likely finishing point might be a Fibonacci 61.8% retracement, which would take sugar closer to the 11-cent level, and potential support in the form of the November 2005 correction lows. Referring back to the chart, we can see that this 11-cent level — and the 61.8% retracement level — proved relatively effective in providing support to the falling market. |

|
| FIGURE 1: SUGAR, CONTINUOUS FUTURES, WEEKLY. The bear market in sugar began early in 2006 and continued throughout the year as the commodity fell more than 40%. Note how sugar has found support at and around the 61.8% retracement level. |
| Graphic provided by: Prophet Financial, Inc. |
| |
| Some of the sideways action in sugar futures late in 2006 and into 2007 may be attributed to a waning momentum to the downside. As Figure 1 shows, a significant amount of support begins to appear as sugar futures move down toward the 9–8 cent area. It should also be pointed out that sugar's bear market has lasted at least a year, which should be a long-enough period of time for a certain complacency (or despondency) to develop on the part of traders who've seen nothing but lower sugar prices over the past several months. So far, the correction in sugar (basis continuous futures) has retraced approximately 61.8% of the advance from the 2004 lows. |
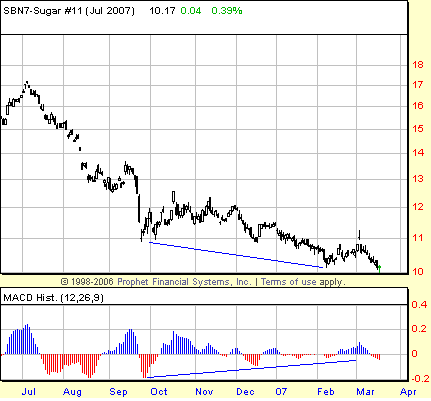
| When you look more closely at the near-month sugar futures contracts such as the July contract, the prevailing bearishness surrounding sugar becomes all the more apparent. Figure 2 shows the long slow slide in sugar futures since late September, as the July contract spent several agonizing months sliding from 12 cents to 10. This slide is characterized also by the positive divergences in the moving average convergence/divergence (MACD) histogram, which suggest a slow-motion loss of momentum to the downside. |

|
| FIGURE 2: SUGAR, JULY FUTURES, DAILY. Positive divergences in the MACD histogram have been growing since December, when the first higher low in the histogram against a lower low in price was recorded. The likelihood of sugar finding a bottom at these levels is greatly enhanced by the positive divergence. |
| Graphic provided by: Prophet Financial, Inc. |
| |
| Beyond the divergences, which have been in effect since December 2006 and became more pronounced as the market moved lower in the first few months of 2007, it could be argued that a month-to-month 2B bottom was developing (February low versus March low). Even though the lower low on March 15 was exceeded the following day, March 16 did not show the sort of determination on the part of the sellers (the market closed above the open and fought off an intraday effort to move prices lower) that would readily qualify the session as having significant follow-through to the downside. In order for that 2B bottom to be realized, July sugar would have to bounce above the 10.4-cent level, which represents the high of the initial low (on February 7). |
| There are also some seasonal considerations that make a spring bottom a timely one for sugar traders. According to the Commodity Traders Almanac 2007, edited by Scott Barrie, sugar typically gets hit in April due to the intricacies of the global harvesting schedule. Buying sugar in May after the "April breaks" and riding that position into June — especially when price appreciation in May is strong — is one of strategies that traders should keep in mind when trying to game the end of sugar's multimonth decline. |
Technical Writer for Technical Analysis of STOCKS & COMMODITIES magazine, Working-Money.com, and Traders.com Advantage.
| Title: | Technical Writer |
| Company: | Technical Analysis, Inc. |
| Address: | 4757 California Avenue SW |
| Seattle, WA 98116 | |
| Phone # for sales: | 206 938 0570 |
| Fax: | 206 938 1307 |
| Website: | www.Traders.com |
| E-mail address: | DPenn@traders.com |
Traders' Resource Links | |
| Charting the Stock Market: The Wyckoff Method -- Books | |
| Working-Money.com -- Online Trading Services | |
| Traders.com Advantage -- Online Trading Services | |
| Technical Analysis of Stocks & Commodities -- Publications and Newsletters | |
| Working Money, at Working-Money.com -- Publications and Newsletters | |
| Traders.com Advantage -- Publications and Newsletters | |
| Professional Traders Starter Kit -- Software | |
Click here for more information about our publications!
Comments
Date: 03/16/07Rank: 2Comment:

Request Information From Our Sponsors
- VectorVest, Inc.
- Executive Premier Workshop
- One-Day Options Course
- OptionsPro
- Retirement Income Workshop
- Sure-Fire Trading Systems (VectorVest, Inc.)
- Trading as a Business Workshop
- VectorVest 7 EOD
- VectorVest 7 RealTime/IntraDay
- VectorVest AutoTester
- VectorVest Educational Services
- VectorVest OnLine
- VectorVest Options Analyzer
- VectorVest ProGraphics v6.0
- VectorVest ProTrader 7
- VectorVest RealTime Derby Tool
- VectorVest Simulator
- VectorVest Variator
- VectorVest Watchdog
- StockCharts.com, Inc.
- Candle Patterns
- Candlestick Charting Explained
- Intermarket Technical Analysis
- John Murphy on Chart Analysis
- John Murphy's Chart Pattern Recognition
- John Murphy's Market Message
- MurphyExplainsMarketAnalysis-Intermarket Analysis
- MurphyExplainsMarketAnalysis-Visual Analysis
- StockCharts.com
- Technical Analysis of the Financial Markets
- The Visual Investor
