HOT TOPICS LIST
- MACD
- Fibonacci
- RSI
- Gann
- ADXR
- Stochastics
- Volume
- Triangles
- Futures
- Cycles
- Volatility
- ZIGZAG
- MESA
- Retracement
- Aroon
INDICATORS LIST
LIST OF TOPICS
PRINT THIS ARTICLE
by David Penn
Three months' worth of price consolidation prove a barrier to crude oil's attempt to move higher in early March.
Position: N/A
David Penn
Technical Writer for Technical Analysis of STOCKS & COMMODITIES magazine, Working-Money.com, and Traders.com Advantage.
PRINT THIS ARTICLE
SUPPORT & RESISTANCE
June Crude Rally Retreats At Resistance
03/16/07 12:18:49 PMby David Penn
Three months' worth of price consolidation prove a barrier to crude oil's attempt to move higher in early March.
Position: N/A
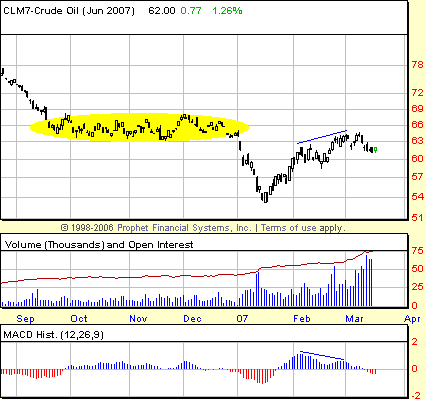
| The June crude oil contract topped back in the late summer of 2006 and has been in a bear market ever since. This bear market has seen June crude fall from its August 2006 high above $80 to a January 2007 low south of $54. See Figure 1. |

|
| FIGURE 1: CRUDE OIL, JUNE FUTURES, DAILY. The consolidation from mid-September through the end of December forms a layer of resistance that blocks crude oil's initial rally off the January 2007 lows. Note how that failure at resistance is accompanied by a negative divergence in the MACD histogram. |
| Graphic provided by: Prophet Financial, Inc. |
| |
| The only interruption in this bear market was a consolidation that developed between $68 and $63 from mid-September to late December. And it is this consolidation that has blocked — at least for the time being — the first significant rally attempt in crude oil in many months. |
| Arguably, this consolidation range was twice tested for resistance. June crude rallied into early February, then failed short of 63. That level represents the lower boundary of the consolidation range from September to December. The market pulled back to below 60 before making another push higher in the second half of February. This second time, June crude managed to penetrate deeper into the consolidation range, reaching as high as 64 in the first few days of March before once again retreating. |

|
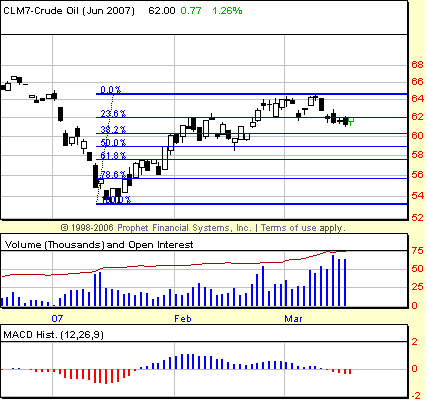
| FIGURE 2: CRUDE OIL, JUNE FUTURES, DAILY. A 50% correction in the rally off the January 2007 lows would find June crude oil testing the lows of February. If June crude moves lower, there is support at the 61.8% retracement level near 58 from the highs of late January that could stem any decline. |
| Graphic provided by: Prophet Financial, Inc. |
| |
| Will the correction be sharply lower — or more sideways? While the negative divergence in the moving average convergence/divergence (MACD) histogram means that a correction of some variety is likely, there is a good chance that any correction will be relatively mild. There is the potential that June crude will find support somewhere between the 38.2% Fibonacci retracement level just north of 60 and the 61.8% Fibonacci retracement level just south of 58 (Figure 2). Although not shown, it is worth noting that the rally off the January lows retraced 38.2% of the decline from the August 2006 peak before running into resistance. |
| In addition, it is worth remembering that June crude has been in a bear market since August 2006. While lower crude oil prices seem likely in the near term, any move lower would only hasten the moment when crude oil finally bottoms. On balance, crude oil tends to have favorable seasonality in the late spring moving into the summer "driving and air conditioning" season. A spring bottom in crude oil would go a long way toward paving the way for higher crude oil prices come summer. |
Technical Writer for Technical Analysis of STOCKS & COMMODITIES magazine, Working-Money.com, and Traders.com Advantage.
| Title: | Technical Writer |
| Company: | Technical Analysis, Inc. |
| Address: | 4757 California Avenue SW |
| Seattle, WA 98116 | |
| Phone # for sales: | 206 938 0570 |
| Fax: | 206 938 1307 |
| Website: | www.Traders.com |
| E-mail address: | DPenn@traders.com |
Traders' Resource Links | |
| Charting the Stock Market: The Wyckoff Method -- Books | |
| Working-Money.com -- Online Trading Services | |
| Traders.com Advantage -- Online Trading Services | |
| Technical Analysis of Stocks & Commodities -- Publications and Newsletters | |
| Working Money, at Working-Money.com -- Publications and Newsletters | |
| Traders.com Advantage -- Publications and Newsletters | |
| Professional Traders Starter Kit -- Software | |
Click here for more information about our publications!
Comments
Date: 03/16/07Rank: 3Comment:

Request Information From Our Sponsors
- StockCharts.com, Inc.
- Candle Patterns
- Candlestick Charting Explained
- Intermarket Technical Analysis
- John Murphy on Chart Analysis
- John Murphy's Chart Pattern Recognition
- John Murphy's Market Message
- MurphyExplainsMarketAnalysis-Intermarket Analysis
- MurphyExplainsMarketAnalysis-Visual Analysis
- StockCharts.com
- Technical Analysis of the Financial Markets
- The Visual Investor
- VectorVest, Inc.
- Executive Premier Workshop
- One-Day Options Course
- OptionsPro
- Retirement Income Workshop
- Sure-Fire Trading Systems (VectorVest, Inc.)
- Trading as a Business Workshop
- VectorVest 7 EOD
- VectorVest 7 RealTime/IntraDay
- VectorVest AutoTester
- VectorVest Educational Services
- VectorVest OnLine
- VectorVest Options Analyzer
- VectorVest ProGraphics v6.0
- VectorVest ProTrader 7
- VectorVest RealTime Derby Tool
- VectorVest Simulator
- VectorVest Variator
- VectorVest Watchdog
