

HOT TOPICS LIST
- MACD
- Fibonacci
- RSI
- Gann
- ADXR
- Stochastics
- Volume
- Triangles
- Futures
- Cycles
- Volatility
- ZIGZAG
- MESA
- Retracement
- Aroon
INDICATORS LIST
LIST OF TOPICS
PRINT THIS ARTICLE
by David Penn
In another sign of waning momentum to the downside in the S&P 500, a 2B pattern appears.
Position: N/A
David Penn
Technical Writer for Technical Analysis of STOCKS & COMMODITIES magazine, Working-Money.com, and Traders.com Advantage.
PRINT THIS ARTICLE
REVERSAL
Short-Term 2B Bottom In The S&P 500
03/16/07 09:56:31 AMby David Penn
In another sign of waning momentum to the downside in the S&P 500, a 2B pattern appears.
Position: N/A
| Truth told, in spite of my suspicions that an important top would form at around the 1460 level (see my February 28th Working-Money.com article, "Fifth Of A Fifth," for more on that projection), I've been looking for signs of a bottom to the current correction in the Standard & Poor's 500 almost since the market began moving lower ("The S&P 500's Fibonacci Foraging For A Bottom" from February 27, "Betting On The Bounce" from March 1, and "Building A Better Bottom" from March 7). |
|
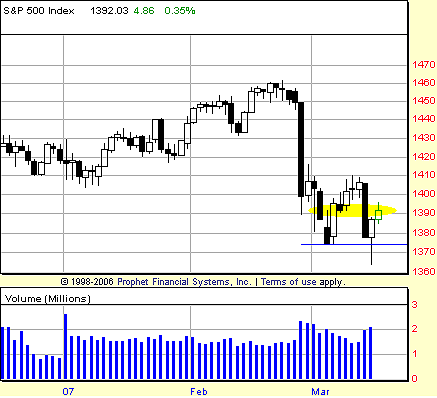
| FIGURE 1: STANDARD & POOR'S 500, DAILY. The fact that the lower low in March occurred in a session during which buyers were able to close the market far from the lows adds to the likelihood that this 2B bottom will result in higher prices in the S&P 500 in the near term. |
| Graphic provided by: Prophet Financial, Inc. |
| |
| So forgive me if I post another installment of "The Bottom Is Coming!" A number of commentators have pointed to the dramatic increase in pessimism among investors as the market made its very-long-overdue correction in the early spring of 2007. And that swift shift toward the "end is near" way of looking at the world was part of what made me so eager to find signs that this correction might not be quite all that it is cracked up to be. This 2B bottom in the S&P 500 is perhaps another initiative in that effort. Two of the better ways of spotting bottoms, in my opinion, are positive divergences in indicators and oscillators like the moving average convergence/divergence (MACD) and MACD histogram and the stochastic on the one hand, and 2B tests of bottom on the other. At present, it appears as if the current correction in the S&P 500 has finally developed examples of both. |
| Figure 1 shows how the S&P 500 made a low in early March, bounced into resistance at the 1410 area, then moved lower to make a lower low in mid-March. However, there are two factors about this lower low that should alert traders to the potential for upside in the near term. The first is the long "shadow" or "tail" on the candlestick symbolizing the midmonth lower low. This means that the bears were completely thwarted in their effort to move the market lower during the session. The second factor follows from the first. Rather than moving lower in the wake of the lower low in mid-March, the S&P 500 moved higher — so much so that on an intraday basis, the session high from the previous low (early in the month) was bested. |
|
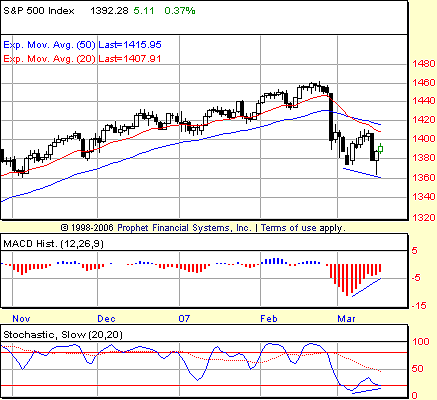
| FIGURE 2: STANDARD & POOR'S 500, DAILY. Positive divergences in both the MACD histogram and the stochastic both help support the case for a bounce in the wake of this 2B bottom. |
| Graphic provided by: Prophet Financial, Inc. |
| |
| That kind of move is usually enough to trigger a buy signal in the 2B top methodology (buy when the non follow-through from the lower low rallies high enough to take out the high of the previous low). And the context of the positive divergences in two key indicators — the MACD histogram and the stochastic — provides about as much market-moving-higher insurance as a trader can expect (see Figure 2). If nothing else, a trader could use the low of the lower low in mid-March as a mental stop, abandoning the trade if the market reversed its bounce, began to move lower, and eventually moving to make an even lower low later in the month. |
| What sort of upside might the bounce bring? There is significant moving average resistance at the 1405–1410 level — resistance that blocked the bounce in the S&P 500 when it was encountered in the first half of the month. And it should be expected that the next time the S&P 500 encounters this level there will be some measure of difficulty once again. That said, there is a swing rule projection based on the two troughs in early and in mid-March that suggests the possibility of a move to the 1440–1450 area. This is based on the midmonth lower low near 1360 and the intratrough high at about 1410. |
Technical Writer for Technical Analysis of STOCKS & COMMODITIES magazine, Working-Money.com, and Traders.com Advantage.
| Title: | Technical Writer |
| Company: | Technical Analysis, Inc. |
| Address: | 4757 California Avenue SW |
| Seattle, WA 98116 | |
| Phone # for sales: | 206 938 0570 |
| Fax: | 206 938 1307 |
| Website: | www.Traders.com |
| E-mail address: | DPenn@traders.com |
Traders' Resource Links | |
| Charting the Stock Market: The Wyckoff Method -- Books | |
| Working-Money.com -- Online Trading Services | |
| Traders.com Advantage -- Online Trading Services | |
| Technical Analysis of Stocks & Commodities -- Publications and Newsletters | |
| Working Money, at Working-Money.com -- Publications and Newsletters | |
| Traders.com Advantage -- Publications and Newsletters | |
| Professional Traders Starter Kit -- Software | |
Click here for more information about our publications!
Comments
Date:�03/16/07Rank:�3Comment:�

Request Information From Our Sponsors
- StockCharts.com, Inc.
- Candle Patterns
- Candlestick Charting Explained
- Intermarket Technical Analysis
- John Murphy on Chart Analysis
- John Murphy's Chart Pattern Recognition
- John Murphy's Market Message
- MurphyExplainsMarketAnalysis-Intermarket Analysis
- MurphyExplainsMarketAnalysis-Visual Analysis
- StockCharts.com
- Technical Analysis of the Financial Markets
- The Visual Investor
- VectorVest, Inc.
- Executive Premier Workshop
- One-Day Options Course
- OptionsPro
- Retirement Income Workshop
- Sure-Fire Trading Systems (VectorVest, Inc.)
- Trading as a Business Workshop
- VectorVest 7 EOD
- VectorVest 7 RealTime/IntraDay
- VectorVest AutoTester
- VectorVest Educational Services
- VectorVest OnLine
- VectorVest Options Analyzer
- VectorVest ProGraphics v6.0
- VectorVest ProTrader 7
- VectorVest RealTime Derby Tool
- VectorVest Simulator
- VectorVest Variator
- VectorVest Watchdog