HOT TOPICS LIST
- MACD
- Fibonacci
- RSI
- Gann
- ADXR
- Stochastics
- Volume
- Triangles
- Futures
- Cycles
- Volatility
- ZIGZAG
- MESA
- Retracement
- Aroon
INDICATORS LIST
LIST OF TOPICS
PRINT THIS ARTICLE
by Chaitali Mohile
Aftermarket Technology is ready to move toward its previous high with a bullish engulfing pattern on its chart.
Position: Buy
Chaitali Mohile
Active trader in the Indian stock markets since 2003 and a full-time writer. Trading is largely based upon technical analysis.
PRINT THIS ARTICLE
CANDLESTICK CHARTING
ATAC Creates New Opportunity
03/16/07 10:12:29 AMby Chaitali Mohile
Aftermarket Technology is ready to move toward its previous high with a bullish engulfing pattern on its chart.
Position: Buy
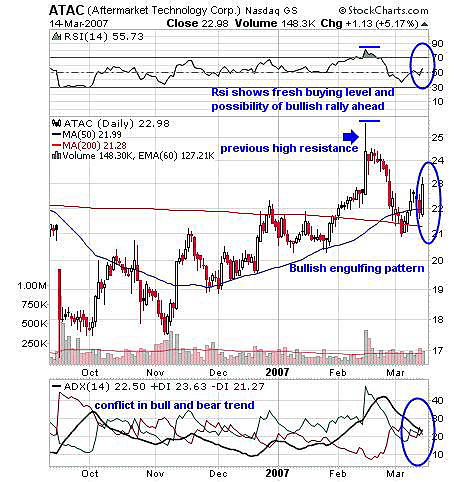
| When a big white candle completely engulfs the previous small black candle, a bullish engulfing pattern is formed. This candlestick pattern indicates an end to the declining rally of the stock. Aftermarket Technology Corp. (ATAC) has formed a bullish engulfing pattern on its daily chart (Figure 1). The red candle formed on March 13 is completely engulfed by the white candle formed on March 14. In Figure 1, the pattern has established support on a 50-day moving average. This adds strength to the formation and the possibility of an advance rally. The following bullish rally will lead toward the previous high at $25.50. Generally, a previous high pivot will act as resistance so traders may see some profit booking there. |

|
| FIGURE 1: ATAC, DAILY. A bullish engulfing pattern establishes support on the moving average. |
| Graphic provided by: StockCharts.com. |
| |
| The average directional movement index (ADX)(14) at 22 shows a crucial turning point for buyers as well sellers. It shows a tough fight between bulls and bears to take over the charge of the trend. The bullish engulfing pattern indicates that the bulls take control of the stock, and as a result, the buyers' pressure is likely to increase in the ADX. The relative strength index (RSI) (14) at 55 opens the buying level for traders and investors. The RSI indicates the rally can successfully move in an upward direction with increasingly bullish force. |
| The overbought RSI must have weakened the rally from $25 that resulted in a correction of $5. In addition, the ADX (14) moved marginally above 40 with a sudden increase in buying pressure. But the rally after the bullish engulfing pattern looks more positive for fresh long positions, and hence, traders can buy with a previous high of $25 as a short-term target. The healthy rally can travel even above $25. |

|
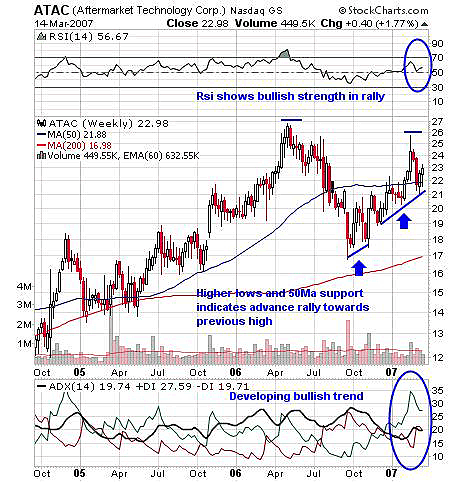
| FIGURE 2: ATAC, WEEKLY. This stock moves upward, making higher lows. |
| Graphic provided by: SuperCharts. |
| |
| Higher lows are a bullish indication on charts. The stock that gives such an indication runs faster. Traders can catch these moves considering strong supports only. In Figure 2, ATAC has also made higher lows and now stands on strong support of 50-day MA. Though the price slipped from $25.50, the RSI held its support strongly at 50, indicating strength in rally. The price pulled back immediately and the RSI moved to 56, confirming the strength of the advance rally. The ADX (14) indicates a developing bullish trend. |
| Thus, the bullish engulfing can be treated as a signal indicator of a fresh upward rally. As candlestick patterns are short-term patterns for more confirmation, some strong indicators are used. |
Active trader in the Indian stock markets since 2003 and a full-time writer. Trading is largely based upon technical analysis.
| Company: | Independent |
| Address: | C1/3 Parth Indraprasth Towers. Vastrapur |
| Ahmedabad, Guj 380015 | |
| E-mail address: | chaitalimohile@yahoo.co.in |
Traders' Resource Links | |
| Independent has not added any product or service information to TRADERS' RESOURCE. | |
Click here for more information about our publications!
Comments
Date: 03/16/07Rank: 4Comment:

Request Information From Our Sponsors
- StockCharts.com, Inc.
- Candle Patterns
- Candlestick Charting Explained
- Intermarket Technical Analysis
- John Murphy on Chart Analysis
- John Murphy's Chart Pattern Recognition
- John Murphy's Market Message
- MurphyExplainsMarketAnalysis-Intermarket Analysis
- MurphyExplainsMarketAnalysis-Visual Analysis
- StockCharts.com
- Technical Analysis of the Financial Markets
- The Visual Investor
- VectorVest, Inc.
- Executive Premier Workshop
- One-Day Options Course
- OptionsPro
- Retirement Income Workshop
- Sure-Fire Trading Systems (VectorVest, Inc.)
- Trading as a Business Workshop
- VectorVest 7 EOD
- VectorVest 7 RealTime/IntraDay
- VectorVest AutoTester
- VectorVest Educational Services
- VectorVest OnLine
- VectorVest Options Analyzer
- VectorVest ProGraphics v6.0
- VectorVest ProTrader 7
- VectorVest RealTime Derby Tool
- VectorVest Simulator
- VectorVest Variator
- VectorVest Watchdog
