HOT TOPICS LIST
- MACD
- Fibonacci
- RSI
- Gann
- ADXR
- Stochastics
- Volume
- Triangles
- Futures
- Cycles
- Volatility
- ZIGZAG
- MESA
- Retracement
- Aroon
INDICATORS LIST
LIST OF TOPICS
PRINT THIS ARTICLE
by Jayanthi Gopalakrishnan
A linear regression line is a useful tool for determining the general direction of a trend.
Position: Buy
Jayanthi Gopalakrishnan
PRINT THIS ARTICLE
LIN. REGTREND
Linear Regression Lines and US Treasury Bonds
11/17/00 02:15:08 PMby Jayanthi Gopalakrishnan
A linear regression line is a useful tool for determining the general direction of a trend.
Position: Buy
| The linear regression line is constructed using the least squares method. This results in a straight line that goes through prices unlike trendlines that are drawn by connecting high and low points. |
| The point where the straight line intersects with a price bar can be thought of as an equilibrium price. When prices drift above the linear regression line, it is indicative of buyers entering the market whereas when below it, it implies the dominance of sellers. |

|
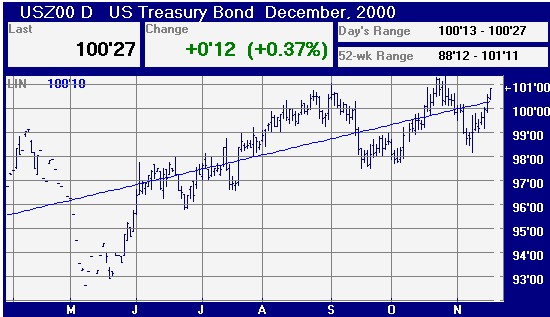
| Treasury bond prices have drifted above the linear regression line. Could this be a buy signal? |
| Graphic provided by: FutureSource.com. |
| |
| The chart of the December 2000 US 30 year T-bond contract displays prices drifting above the upward sloping linear regression line. In the midst of a nervous stock market this positive sign is indeed refreshing but the caution flag is still up. It looks like bonds may face a tough resistance just above $101. |
| Title: | Editor |
| Company: | Technical Analysis of Stocks & Commodities |
| Address: | 4757 California Ave SW |
| Seattle, WA 98116 | |
| Website: | Traders.com |
| E-mail address: | Jayanthi@traders.com |
Traders' Resource Links | |
| Charting the Stock Market: The Wyckoff Method -- Books | |
| Working-Money.com -- Online Trading Services | |
| Traders.com Advantage -- Online Trading Services | |
| Technical Analysis of Stocks & Commodities -- Publications and Newsletters | |
| Working Money, at Working-Money.com -- Publications and Newsletters | |
| Traders.com Advantage -- Publications and Newsletters | |
| Professional Traders Starter Kit -- Software | |
Click here for more information about our publications!
Comments

Request Information From Our Sponsors
- StockCharts.com, Inc.
- Candle Patterns
- Candlestick Charting Explained
- Intermarket Technical Analysis
- John Murphy on Chart Analysis
- John Murphy's Chart Pattern Recognition
- John Murphy's Market Message
- MurphyExplainsMarketAnalysis-Intermarket Analysis
- MurphyExplainsMarketAnalysis-Visual Analysis
- StockCharts.com
- Technical Analysis of the Financial Markets
- The Visual Investor
- VectorVest, Inc.
- Executive Premier Workshop
- One-Day Options Course
- OptionsPro
- Retirement Income Workshop
- Sure-Fire Trading Systems (VectorVest, Inc.)
- Trading as a Business Workshop
- VectorVest 7 EOD
- VectorVest 7 RealTime/IntraDay
- VectorVest AutoTester
- VectorVest Educational Services
- VectorVest OnLine
- VectorVest Options Analyzer
- VectorVest ProGraphics v6.0
- VectorVest ProTrader 7
- VectorVest RealTime Derby Tool
- VectorVest Simulator
- VectorVest Variator
- VectorVest Watchdog
