HOT TOPICS LIST
- MACD
- Fibonacci
- RSI
- Gann
- ADXR
- Stochastics
- Volume
- Triangles
- Futures
- Cycles
- Volatility
- ZIGZAG
- MESA
- Retracement
- Aroon
INDICATORS LIST
LIST OF TOPICS
PRINT THIS ARTICLE
by Chaitali Mohile
Low volume and an overheated ADX results in a failed breakout of an ascending triangle. The trend remains strong, but the ADX in a weekly time frame affects the breakout.
Position: N/A
Chaitali Mohile
Active trader in the Indian stock markets since 2003 and a full-time writer. Trading is largely based upon technical analysis.
PRINT THIS ARTICLE
ASCENDING TRIANGLES
Innospec, Inc. Breakout Fails
03/16/07 11:40:32 AMby Chaitali Mohile
Low volume and an overheated ADX results in a failed breakout of an ascending triangle. The trend remains strong, but the ADX in a weekly time frame affects the breakout.
Position: N/A
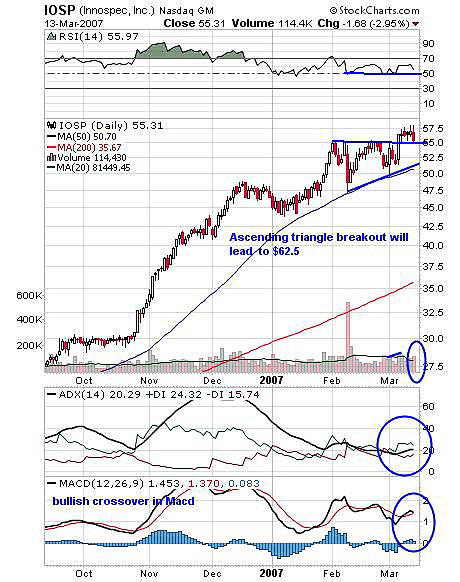
| The ascending triangle is a continuation pattern in an uptrend. The breakout in this formation is always in the direction of the trend. Innospec, Inc., has formed similar formation on its daily charts (Figure 1). The volume has reduced as the triangle matured. But the higher-volume breakout was lacking. Due to low volume, the price consolidated instead of moving vertically toward the target. The relative strength index (RSI) (14) was moving in a narrow range of 50-70 as a triangle was forming. So with the price breakout, the RSI should have moved above its range but reversed. This indicates lack of strength in a bullish rally. The RSI has not moved below 50, so if more weakness comes in, it may move down further. As a result, the price may slip to test the support of buyers at $52.50. |
| This failed breakout also shows the risk in an assumed breakout entry. Traders can see the consolidation range before positioning themselves. The average directional movement index (ADX)(14) has moved above 15, indicating the developing uptrend in Figure 1. The moving average convergence/divergence (MACD)(12,26,9) has given bullish crossover but has failed to turn positive. The RSI and the MACD both do not give encouraging signals for the traders to go long, but they should remember the trend is still up. |

|
| FIGURE 1: INNOSPEC, DAILY. Here's the failed triangular breakout. |
| Graphic provided by: StockCharts.com. |
| |
| The traders can observe the consolidation breakout. On an ascending triangle, the width of the triangle is considered to calculate the target. Here, the width is at $7.50 ($55-$47.50). Adding $7.50 to $55, we get the target of $62.50. Since the breakout failed, however, I would watch the supports hold. Traders should not buy till the stock gives any specific direction. |
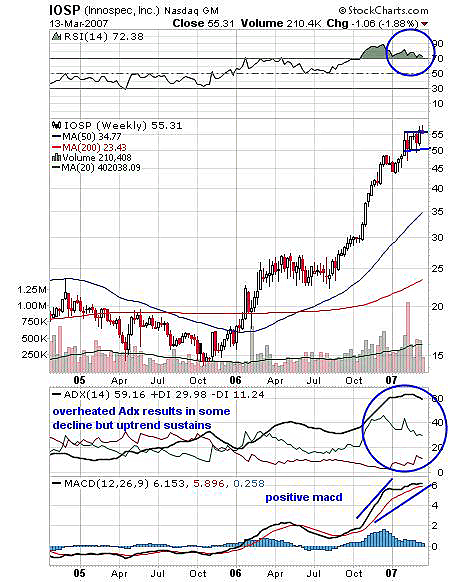
| IOSP in Figure 2 shows highly overheated ADX (14) at 59. The price is seen moving within a range for the last few weeks. That's a reflection of the ADX levels. The indicator is likely to decline more to create some space for a bullish trend. The RSI (14) is also overbought, so upward rally may see some volatility. |

|
| FIGURE 2: INNOSPEC, WEEKLY. Here's the highly overheated ADX. |
| Graphic provided by: TC2000.com. |
| |
| Traders can consider all these possibilities before entering the stock. Traders always know the breakout may fail however strong the formation is. This failed triangular breakout is one such illustration. Again, volume and indicator levels are important while the stock breaks out. |
Active trader in the Indian stock markets since 2003 and a full-time writer. Trading is largely based upon technical analysis.
| Company: | Independent |
| Address: | C1/3 Parth Indraprasth Towers. Vastrapur |
| Ahmedabad, Guj 380015 | |
| E-mail address: | chaitalimohile@yahoo.co.in |
Traders' Resource Links | |
| Independent has not added any product or service information to TRADERS' RESOURCE. | |
Click here for more information about our publications!
Comments
Date: 03/16/07Rank: 4Comment:

Request Information From Our Sponsors
- StockCharts.com, Inc.
- Candle Patterns
- Candlestick Charting Explained
- Intermarket Technical Analysis
- John Murphy on Chart Analysis
- John Murphy's Chart Pattern Recognition
- John Murphy's Market Message
- MurphyExplainsMarketAnalysis-Intermarket Analysis
- MurphyExplainsMarketAnalysis-Visual Analysis
- StockCharts.com
- Technical Analysis of the Financial Markets
- The Visual Investor
- VectorVest, Inc.
- Executive Premier Workshop
- One-Day Options Course
- OptionsPro
- Retirement Income Workshop
- Sure-Fire Trading Systems (VectorVest, Inc.)
- Trading as a Business Workshop
- VectorVest 7 EOD
- VectorVest 7 RealTime/IntraDay
- VectorVest AutoTester
- VectorVest Educational Services
- VectorVest OnLine
- VectorVest Options Analyzer
- VectorVest ProGraphics v6.0
- VectorVest ProTrader 7
- VectorVest RealTime Derby Tool
- VectorVest Simulator
- VectorVest Variator
- VectorVest Watchdog
