HOT TOPICS LIST
- MACD
- Fibonacci
- RSI
- Gann
- ADXR
- Stochastics
- Volume
- Triangles
- Futures
- Cycles
- Volatility
- ZIGZAG
- MESA
- Retracement
- Aroon
INDICATORS LIST
LIST OF TOPICS
PRINT THIS ARTICLE
by Chaitali Mohile
Certain stocks with steady growth are portfolio candidates. CF Industries Holding is one.
Position: Buy
Chaitali Mohile
Active trader in the Indian stock markets since 2003 and a full-time writer. Trading is largely based upon technical analysis.
PRINT THIS ARTICLE
TECHNICAL ANALYSIS
CF Rallies
03/15/07 09:26:11 AMby Chaitali Mohile
Certain stocks with steady growth are portfolio candidates. CF Industries Holding is one.
Position: Buy
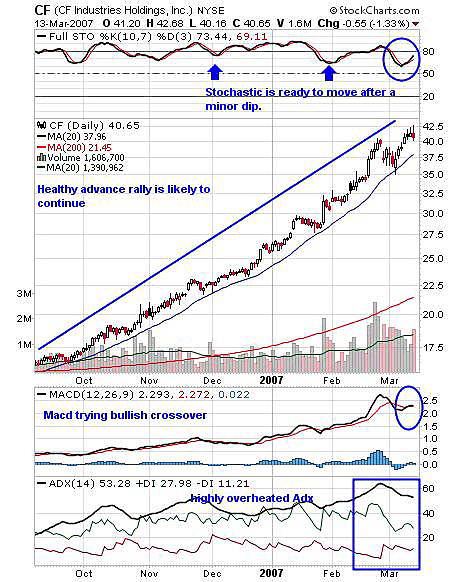
| CF Industries (CF) is in a strong uptrend. The stock is moving upward steadily with good support of its 20-day moving average (MA). Volume is also evenly maintained at every phase. Figure 1, the daily chart, shows that the stock has maintained its rally, which started from October 2006; $17.50 to $42.50 is a long path to travel, holding strength uniform at each level. CF's small consolidation phases and even much smaller dips can be seen. While undergoing these stages, the 20-day MA support was held. This stock is good for portfolio investment, though short-term trades are also possible. |

|
| FIGURE 1: CF, DAILY. The 20-day moving average shows the direction of the rally and the price has followed the 20-day moving average. |
| Graphic provided by: StockCharts.com. |
| |
| The full stochastic (10,7,3) also indicates the healthy movement of the stock. Stochastics have not moved below 60. The smaller curves marked by arrows shows the consolidation that the stock was undergoing, and even the dip. But the stochastic recovered soon by moving in a marginally overbought zone. This points out the strength in the rally. At $42.50, the stochastic is at 69.11, which indicates the stock has more space to move. The moving average convergence/divergence (MACD) (12,26,9) at current levels is trying a bullish crossover, and the histogram is also crossing its zero line. |
| Here, I would like to point out the possibility of a small consolidation or a dip in this stock. Since average directional movement index (ADX)(14) is highly overheated at 53, the indicator will undergo some decline. But this decline will bring no harm to the uptrend till it is above 20. With this decline in ADX, the stock may form a flag & pennant on the daily chart. So those traders already long can hold with a stop-loss below 20-day MA and a fresh long is possible above $42.50. |

|
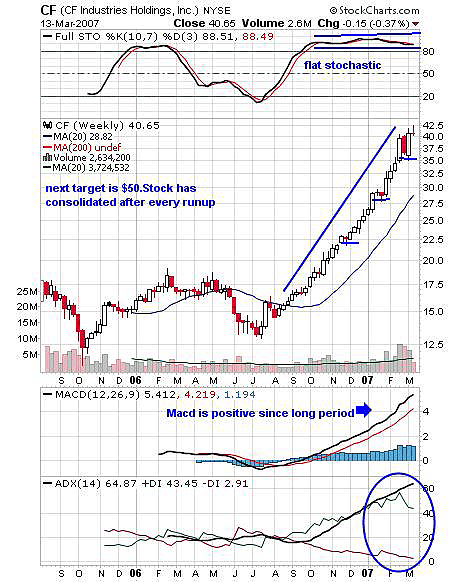
| FIGURE 2: CF, WEEKLY. The stock has bottomed out and moved vertically. |
| Graphic provided by: StockCharts.com. |
| |
| The weekly chart (Figure 2) also shows a vertical move of CF. The stock was consolidating for almost a year, October 2005 to October 2006. The stock was bottoming out, which gave birth to an advance rally from $17.50 to $42.50. As the stock started its move up, the stochastic (10,7,3) went overbought. But this oscillator has the feature of moving flat with particular importance. The stochastic can move flat at an overbought/oversold condition for much longer periods. The stochastic at present is overbought and flat, so this indicates it can carry the rally still further. The MACD (12,26,9) is positive throughout the rally. The ADX (14) again is overheated on weekly chart as well. So this confirms the possibility of some consolidation or small dip during the rally. |
| Traders can go long above $42.50 for a low-risk entry with the target of $50. As the stock has held its support at every change in phase, a stop-loss of $37.50 is likely. The target can be calculated by considering the previous rally from $30 to $40. By adding $10 on this rally to $40, traders can see the target of $50. I would suggest traders and investors to stay long with this target and consider this stock for their portfolio. |
Active trader in the Indian stock markets since 2003 and a full-time writer. Trading is largely based upon technical analysis.
| Company: | Independent |
| Address: | C1/3 Parth Indraprasth Towers. Vastrapur |
| Ahmedabad, Guj 380015 | |
| E-mail address: | chaitalimohile@yahoo.co.in |
Traders' Resource Links | |
| Independent has not added any product or service information to TRADERS' RESOURCE. | |
Click here for more information about our publications!
Comments
Date: 03/15/07Rank: 4Comment:

Request Information From Our Sponsors
- StockCharts.com, Inc.
- Candle Patterns
- Candlestick Charting Explained
- Intermarket Technical Analysis
- John Murphy on Chart Analysis
- John Murphy's Chart Pattern Recognition
- John Murphy's Market Message
- MurphyExplainsMarketAnalysis-Intermarket Analysis
- MurphyExplainsMarketAnalysis-Visual Analysis
- StockCharts.com
- Technical Analysis of the Financial Markets
- The Visual Investor
- VectorVest, Inc.
- Executive Premier Workshop
- One-Day Options Course
- OptionsPro
- Retirement Income Workshop
- Sure-Fire Trading Systems (VectorVest, Inc.)
- Trading as a Business Workshop
- VectorVest 7 EOD
- VectorVest 7 RealTime/IntraDay
- VectorVest AutoTester
- VectorVest Educational Services
- VectorVest OnLine
- VectorVest Options Analyzer
- VectorVest ProGraphics v6.0
- VectorVest ProTrader 7
- VectorVest RealTime Derby Tool
- VectorVest Simulator
- VectorVest Variator
- VectorVest Watchdog
