HOT TOPICS LIST
- MACD
- Fibonacci
- RSI
- Gann
- ADXR
- Stochastics
- Volume
- Triangles
- Futures
- Cycles
- Volatility
- ZIGZAG
- MESA
- Retracement
- Aroon
INDICATORS LIST
LIST OF TOPICS
PRINT THIS ARTICLE
by David Penn
Divergences tell the tale of the March bounce in June gold.
Position: N/A
David Penn
Technical Writer for Technical Analysis of STOCKS & COMMODITIES magazine, Working-Money.com, and Traders.com Advantage.
PRINT THIS ARTICLE
REVERSAL
The Gold Correction
03/09/07 11:21:21 AMby David Penn
Divergences tell the tale of the March bounce in June gold.
Position: N/A
| There were a few additional thoughts on gold that I didn't want to cram into my earlier article on the subject, "Waving The Gold." While those thoughts aren't Elliott wave–related, they do support the "lower before higher" case that suggests that the correction in gold has room to run. |

|
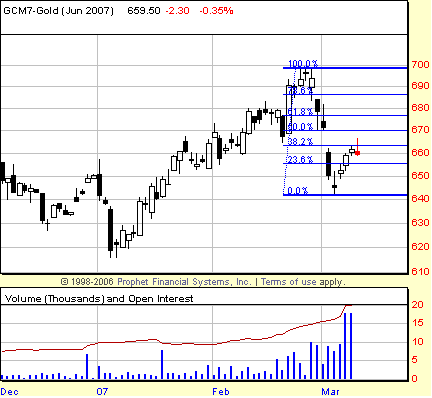
| FIGURE 1: GOLD, JUNE FUTURES, DAILY. The late February/early March correction in June gold retraced just over 61.8% of the rally from the January lows. The bounce that began in March appears to have run into resistance at another Fibonacci retracement level, 38.2%. |
| Graphic provided by: Prophet Financial, Inc. |
| |
| June gold has been pretty faithful to the limits of Fibonacci retracement. The correction itself bounced shortly after breaching the 61.8% Fibonacci retracement of gold's advance from early January to late February. And the current correction appears to have topped just as it was testing the other key Fibonacci retracement at 38.2%. Note that this retracement level also coincides with gap resistance from the early March portion of June gold's decline. (See Figure 1.) |

|
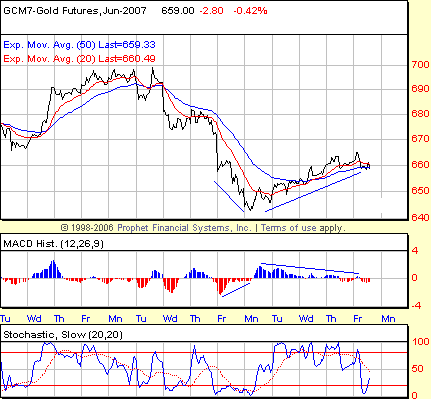
| FIGURE 2: GOLD, JUNE FUTURES, 15-MINUTE. A positive divergence in the MACD histogram signaled a key low in the decline of June gold. But the rally that followed has been accompanied by a growing negative divergence in the same indicator, increasing the likelihood that the move higher will be corrected. |
| Graphic provided by: Prophet Financial, Inc. |
| |
| The intraday line chart of June gold in Figure 2 shows not only the positive divergence in the moving average convergence/divergence (MACD) histogram that led to the bounce, but also the lengthy and growing negative divergences that threaten to end the advance. Moving average support (in red and blue) remains a possibility, and the consequence of the negative MACD histogram divergences could be sideways trading rather than movement that is sharply downward. Yet given the sharpness of the initial correction from the late February high, and the sharpness of the early March bounce today, traders could be forgiven for hoping for a more lasting meaningful correction — as opposed to a V-shaped one — that might produce a more lasting move higher to the February highs and beyond. |
Technical Writer for Technical Analysis of STOCKS & COMMODITIES magazine, Working-Money.com, and Traders.com Advantage.
| Title: | Technical Writer |
| Company: | Technical Analysis, Inc. |
| Address: | 4757 California Avenue SW |
| Seattle, WA 98116 | |
| Phone # for sales: | 206 938 0570 |
| Fax: | 206 938 1307 |
| Website: | www.Traders.com |
| E-mail address: | DPenn@traders.com |
Traders' Resource Links | |
| Charting the Stock Market: The Wyckoff Method -- Books | |
| Working-Money.com -- Online Trading Services | |
| Traders.com Advantage -- Online Trading Services | |
| Technical Analysis of Stocks & Commodities -- Publications and Newsletters | |
| Working Money, at Working-Money.com -- Publications and Newsletters | |
| Traders.com Advantage -- Publications and Newsletters | |
| Professional Traders Starter Kit -- Software | |
Click here for more information about our publications!
Comments
Date: 03/09/07Rank: 3Comment:
Date: 03/12/07Rank: 3Comment:

Request Information From Our Sponsors
- StockCharts.com, Inc.
- Candle Patterns
- Candlestick Charting Explained
- Intermarket Technical Analysis
- John Murphy on Chart Analysis
- John Murphy's Chart Pattern Recognition
- John Murphy's Market Message
- MurphyExplainsMarketAnalysis-Intermarket Analysis
- MurphyExplainsMarketAnalysis-Visual Analysis
- StockCharts.com
- Technical Analysis of the Financial Markets
- The Visual Investor
- VectorVest, Inc.
- Executive Premier Workshop
- One-Day Options Course
- OptionsPro
- Retirement Income Workshop
- Sure-Fire Trading Systems (VectorVest, Inc.)
- Trading as a Business Workshop
- VectorVest 7 EOD
- VectorVest 7 RealTime/IntraDay
- VectorVest AutoTester
- VectorVest Educational Services
- VectorVest OnLine
- VectorVest Options Analyzer
- VectorVest ProGraphics v6.0
- VectorVest ProTrader 7
- VectorVest RealTime Derby Tool
- VectorVest Simulator
- VectorVest Variator
- VectorVest Watchdog
