HOT TOPICS LIST
- MACD
- Fibonacci
- RSI
- Gann
- ADXR
- Stochastics
- Volume
- Triangles
- Futures
- Cycles
- Volatility
- ZIGZAG
- MESA
- Retracement
- Aroon
INDICATORS LIST
LIST OF TOPICS
PRINT THIS ARTICLE
by David Penn
Competing theses on gold nevertheless suggest going lower before higher.
Position: N/A
David Penn
Technical Writer for Technical Analysis of STOCKS & COMMODITIES magazine, Working-Money.com, and Traders.com Advantage.
PRINT THIS ARTICLE
ELLIOTT WAVE
Waving The Gold
03/08/07 03:33:58 PMby David Penn
Competing theses on gold nevertheless suggest going lower before higher.
Position: N/A
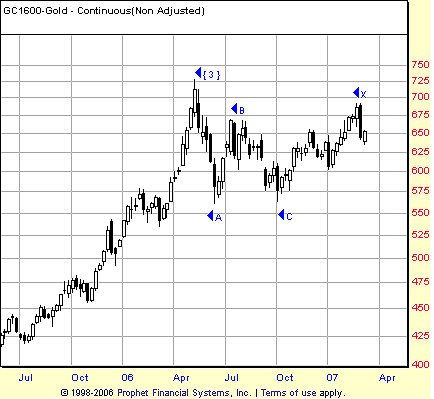
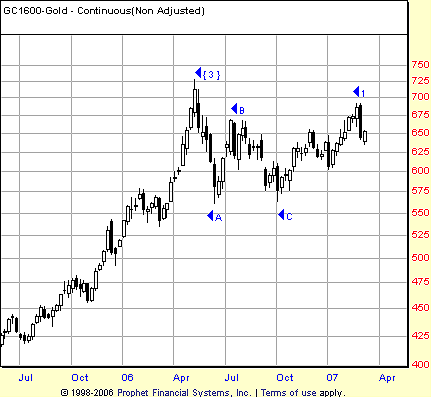
| Preparing for a conference call on precious metals, I ended up developing two different takes on the gold market. The first take, the correction thesis (Figure 1), points to a gold market that is only halfway through a fourth-wave, double-3 type of Elliott wave correction. The second take, the October bottom thesis (Figure 2), suggests that on an intermediate-term basis, the downside for gold is over. What is interesting about these two takes is that both indicate that gold should be weaker in the short term, but in the intermediate to longer term, the bull market in gold is likely to resume. |

|
| FIGURE 1: GOLD, CONTINUOUS FUTURES, WEEKLY. My correction thesis posits that gold futures are in a fourth-wave, double-three correction. The first “three” appears to have taken the form of a flat. The wave labeled “x” represented the intermediary wave between the first “three” and the second “three” to come. |
| Graphic provided by: Prophet Financial, Inc. |
| |
| Gold bulls are no less impervious to greed than bulls in any other market, and much of the time when I think of gold proponents I get a strange sense of entitlement, as if gold has been knocked as an investment for so long that now gold bulls are due for their propers, as the kids say. To that, I say: Check the chart. If there is anyone who has not granted gold the respect it deserves, then that is respect not worth waiting for. Gold has been in a solid bull market since testing the bottom in early 2001 — the beginning of the Bush era almost to the week. And after a largely sideways correction in 2004–05, gold went on a tear, rallying from between 425 and 450 during the correction to nearly 723 by the early summer of 2006. So while gold bulls should welcome a correction, the question remains just what kind of correction gold is experiencing right now. Figure 1 shows the correction thesis. It takes the rally from the 2001 lows to the peak in May 2006 as a wave 3 advance. Since that peak, gold futures corrected, then retraced approximately 61.8% of that correction before moving back down to test the lows of the initial move down. To my eyes, this pattern is reminiscent of a flat for two reasons. One, the B-wave retraces at least 61.8% of the A-wave, and two, the C-wave does not move beyond the low point of the A-wave. This correction also seems to pass the "right look" test as mentioned by Robert Prechter and A.J. Frost in their Elliott wave classic, The Elliott Wave Principle. |

|
| FIGURE 2: GOLD, CONTINUOUS FUTURES, WEEKLY. The October bottom thesis suggests that the gold market bottomed in October 2006 and has just completed a five-wave movement to the upside. The current softness in gold prices in this scenario is reflective of a wave 2 decline that should find support before reaching 575. The 600 level looks like one likely source of support, should gold continue to decline. |
| Graphic provided by: Prophet Financial, Inc. |
| |
| If the correction thesis is correct, then gold is a little more than halfway through its correction. With the x-wave complete, all that remains is for gold to develop another "three" correction. This "three" could be another flat, a triangle, or a zigzag. And there is the possibility that gold — depending on the psychology of those in the gold market — will develop a "triple three" rather than a double three. But for now, the correction thesis is limited to the possibility of a double three, which would mean a test of the 575 level. Interestingly, the flat portion of the correction in gold (per the correction thesis) lasted for about five months. If the second three lasts approximately the same amount of time, and we add that five months to the end of the intermediary x-wave (which topped in February), then we get a fourth-wave bottom sometime in summer 2007. What makes this particularly interesting is that gold and silver stocks are known to outperform seasonally from July through September, according to the research of the Hirsches in their Stock Traders Almanac. |
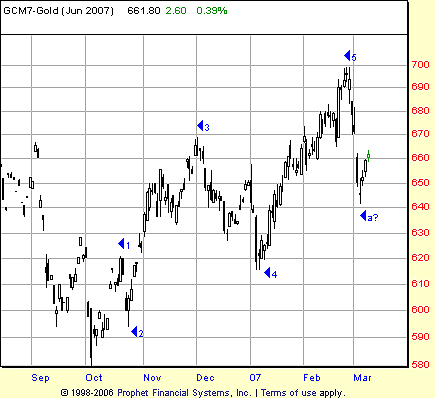
| Just something to keep in mind as the year plays out. The October bottom thesis is similar to the correction thesis in many ways. Both takes see the market as having made a wave 3 top in May 2006, and to have experienced a flat style correction from May 2006 to October 2006. The difference is whether you view the rally from the October bottom as a three-segmented affair or a five-segmented one (Figure 3). If you view it as the former, then the correction thesis seems more likely. However, if you view it as the latter, then the possibility of an October bottom and a new bull trend upward increasingly appears as the more probable interpretation. |

|
| FIGURE 3: GOLD, JUNE 2007 FUTURES, DAILY. Here's the five-wave advance from the October 2006 bottom as seen through the lens of the October bottom thesis. The March 2007 bounce appears at this point to be the second B-wave of a corrective A-B-C pattern. |
| Graphic provided by: Prophet Financial, Inc. |
| |
| Looking closely at the rally from the October bottom, and noting that the rally topped out just as it was closing in on the May 2006 highs, makes me believe that if you subscribe to the October bottom thesis, then it is likely that the first five waves up from that bottom were completed in February 2007. As such, the market should embark upon a three-segmented, A-B-C correction en route to finishing a wave 2 that would correct the previous wave 1. As a wave 2, this correction should significantly retrace the previous wave 1 — meaning that continued movement lower, perhaps testing the 61.8% retracement level near 600, should be in the cards over the next few weeks. Under no circumstances, according to the October bottom thesis, should the wave 2 correction take out the October 2006 lows on a weekly closing basis. If it did, then that would be one good reason for moving (or keeping, depending the thesis you are rooting for) focus to the correction thesis. |
Technical Writer for Technical Analysis of STOCKS & COMMODITIES magazine, Working-Money.com, and Traders.com Advantage.
| Title: | Technical Writer |
| Company: | Technical Analysis, Inc. |
| Address: | 4757 California Avenue SW |
| Seattle, WA 98116 | |
| Phone # for sales: | 206 938 0570 |
| Fax: | 206 938 1307 |
| Website: | www.Traders.com |
| E-mail address: | DPenn@traders.com |
Traders' Resource Links | |
| Charting the Stock Market: The Wyckoff Method -- Books | |
| Working-Money.com -- Online Trading Services | |
| Traders.com Advantage -- Online Trading Services | |
| Technical Analysis of Stocks & Commodities -- Publications and Newsletters | |
| Working Money, at Working-Money.com -- Publications and Newsletters | |
| Traders.com Advantage -- Publications and Newsletters | |
| Professional Traders Starter Kit -- Software | |
Click here for more information about our publications!
Comments
Date: 03/09/07Rank: 3Comment:

Request Information From Our Sponsors
- VectorVest, Inc.
- Executive Premier Workshop
- One-Day Options Course
- OptionsPro
- Retirement Income Workshop
- Sure-Fire Trading Systems (VectorVest, Inc.)
- Trading as a Business Workshop
- VectorVest 7 EOD
- VectorVest 7 RealTime/IntraDay
- VectorVest AutoTester
- VectorVest Educational Services
- VectorVest OnLine
- VectorVest Options Analyzer
- VectorVest ProGraphics v6.0
- VectorVest ProTrader 7
- VectorVest RealTime Derby Tool
- VectorVest Simulator
- VectorVest Variator
- VectorVest Watchdog
- StockCharts.com, Inc.
- Candle Patterns
- Candlestick Charting Explained
- Intermarket Technical Analysis
- John Murphy on Chart Analysis
- John Murphy's Chart Pattern Recognition
- John Murphy's Market Message
- MurphyExplainsMarketAnalysis-Intermarket Analysis
- MurphyExplainsMarketAnalysis-Visual Analysis
- StockCharts.com
- Technical Analysis of the Financial Markets
- The Visual Investor
