HOT TOPICS LIST
- MACD
- Fibonacci
- RSI
- Gann
- ADXR
- Stochastics
- Volume
- Triangles
- Futures
- Cycles
- Volatility
- ZIGZAG
- MESA
- Retracement
- Aroon
INDICATORS LIST
LIST OF TOPICS
PRINT THIS ARTICLE
by Koos van der Merwe
Anyone standing on a beach knows that before a wave crashes on the shore, there is always a pullback of the water. The greater the pullback, the greater the wave.
Position: N/A
Koos van der Merwe
Has been a technical analyst since 1969, and has worked as a futures and options trader with First Financial Futures in Johannesburg, South Africa.
PRINT THIS ARTICLE
ELLIOTT WAVE
The Sucking Before The Tsunami
03/08/07 02:43:19 PMby Koos van der Merwe
Anyone standing on a beach knows that before a wave crashes on the shore, there is always a pullback of the water. The greater the pullback, the greater the wave.
Position: N/A
| Last week, I wrote about the market and the perfect storm. My charts suggested it was possible that a B-wave had probably been completed, and that the market could start falling in a devastating C-wave. Elliott wave theory teaches us that a major C-wave usually falls in a five-wave impulse wave. However, I have seen major C-waves fall in an a-b-c correction. In this case, the c-wave is usually a tidal wave, a tsunami of devastation. See Figure 1. |

|
| |
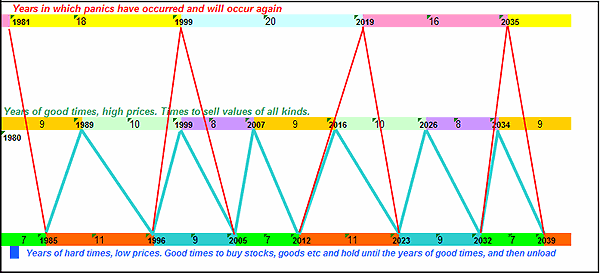
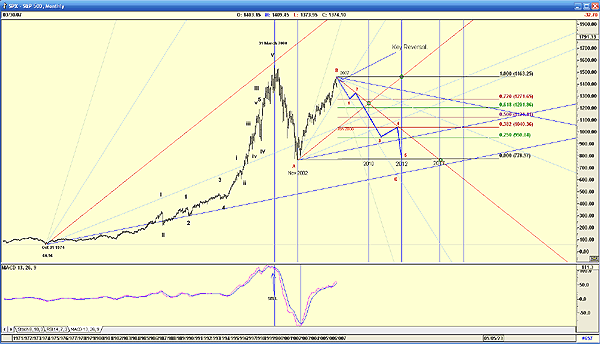
| Will this happen this time around? If we look at the K-wave shown in Figure 2, we can see how the K-wave suggests that from times of good times and high values, the market should fall in 2007 until the year 2012 -- times of hard times and low prices. My wave count, in Figure 2 of the Standard & Poor's 500, suggests that this could truly happen. |

|
| FIGURE 2: S&P 500, MONTHLY.The S&P 500 showing wave count and Gann timing fans. |
| Graphic provided by: AdvancedGET. |
| |
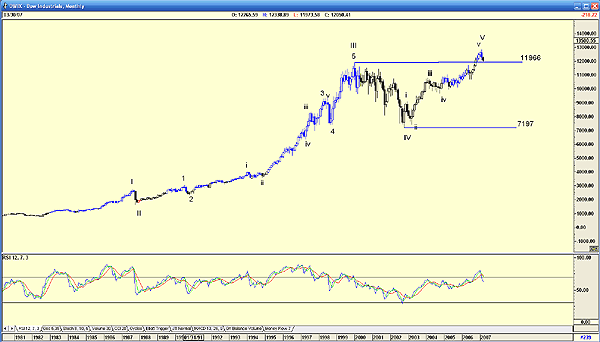
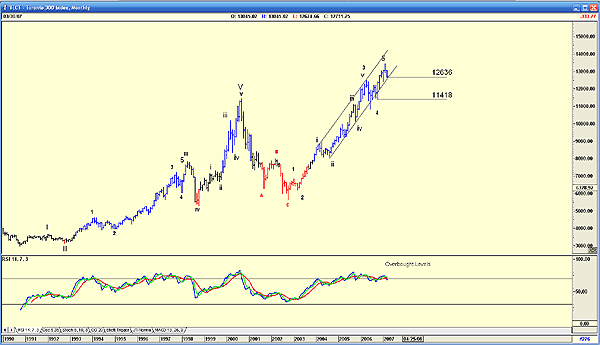
| The Dow Jones Industrial Average (DJIA) (Figure 3), on the other hand, presents a different picture, as does the TSX Canadian Index (Figure 4). The latter is inflated with oil and gold, while the former is made up of the top 35 US companies only. |

|
| FIGURE 3: DJIA, MONTHLY.The DJIA shows an Elliott wave count. |
| Graphic provided by: AdvancedGET. |
| |
| Sales in the US are good, profits are up, and in spite of weakening house sales, nothing dramatic has occurred to hurt the DJIA, which caused the recent rise to exceed the high of 2000. This does give the DJIA a different count to the S&P 500. Either way, a down move is now expected, but where the S&P suggests a significant move, although the height the B-wave reached could reduce fall, with the Dow chart we see that the fall could be anywhere within the fourth wave of lesser degree -- between 11966 and 7197. The relative strength index (RSI), at overbought levels, and having given a sell signal confirms the top of the Dow. |

|
| FIGURE 4: THE TORONTO 300, MONTHLY |
| Graphic provided by: AdvancedGET. |
| |
| With the TSX, it does look as if the coming correction will be a correction to a new impulse wave up, which means that should the index fall below 12636, it could test the 11418 level. Not a big fall and probably held up by oil and gold. Canada is regarded by many as inexorably linked to the United States, but the charts are suggesting that a correction in the US market will NOT be as severe in Canada. To conclude, North American markets are suggesting that a major correction is at hand, but the expected tsunami may turn out to be a far smaller wave, especially in Canada. |
Has been a technical analyst since 1969, and has worked as a futures and options trader with First Financial Futures in Johannesburg, South Africa.
| Address: | 3256 West 24th Ave |
| Vancouver, BC | |
| Phone # for sales: | 6042634214 |
| E-mail address: | petroosp@gmail.com |
Click here for more information about our publications!
Comments
Date: 03/09/07Rank: 2Comment:

Request Information From Our Sponsors
- StockCharts.com, Inc.
- Candle Patterns
- Candlestick Charting Explained
- Intermarket Technical Analysis
- John Murphy on Chart Analysis
- John Murphy's Chart Pattern Recognition
- John Murphy's Market Message
- MurphyExplainsMarketAnalysis-Intermarket Analysis
- MurphyExplainsMarketAnalysis-Visual Analysis
- StockCharts.com
- Technical Analysis of the Financial Markets
- The Visual Investor
- VectorVest, Inc.
- Executive Premier Workshop
- One-Day Options Course
- OptionsPro
- Retirement Income Workshop
- Sure-Fire Trading Systems (VectorVest, Inc.)
- Trading as a Business Workshop
- VectorVest 7 EOD
- VectorVest 7 RealTime/IntraDay
- VectorVest AutoTester
- VectorVest Educational Services
- VectorVest OnLine
- VectorVest Options Analyzer
- VectorVest ProGraphics v6.0
- VectorVest ProTrader 7
- VectorVest RealTime Derby Tool
- VectorVest Simulator
- VectorVest Variator
- VectorVest Watchdog
