HOT TOPICS LIST
- MACD
- Fibonacci
- RSI
- Gann
- ADXR
- Stochastics
- Volume
- Triangles
- Futures
- Cycles
- Volatility
- ZIGZAG
- MESA
- Retracement
- Aroon
INDICATORS LIST
LIST OF TOPICS
PRINT THIS ARTICLE
by David Penn
In the days after the market meltdown, the Standard & Poor's 500 continues to forge a bottom from oversold conditions and positive divergences.
Position: N/A
David Penn
Technical Writer for Technical Analysis of STOCKS & COMMODITIES magazine, Working-Money.com, and Traders.com Advantage.
PRINT THIS ARTICLE
REVERSAL
Building A Better Bottom
03/07/07 02:21:13 PMby David Penn
In the days after the market meltdown, the Standard & Poor's 500 continues to forge a bottom from oversold conditions and positive divergences.
Position: N/A
| There are two contradictory impulses in the wake of a market collapse like the one investors and speculators experienced at the end of February. The first is the "buy the panic" impulse, largely borne out of the experience of severe corrections in bull markets like those in 1987 and 1998. The second is the "wait until the smoke clears" impulse. This impulse is generally the product of a bear market psychology in which sharp declines tend to lead only to further sharp declines. |
I'd argue that the 2002 correction — shortly on the heels of the 2001 correction — was accompanied by this latter impulse. In hindsight, it couldn't have been more clear that autumn 2002 was a buying opportunity the likes of which hadn't been seen since the mid-1990s. But at the time, those standing on their desks screaming "BUY!" were relatively short in number (Jim Cramer, in his excellent dispatch, "The Exquisite Moment Is Upon Us," from March 17, 2003, was one particularly memorable exception):We now are close enough to the war to act. I think the exquisite moment is upon us. The idea behind the exquisite moment is the same as it was in 1991: Wait until 24 hours before the war begins, and buy the weakness of the nervous longs who can't take the pain." Are you a nervous long? If so, how are you taking the pain of the February meltdown? |

|
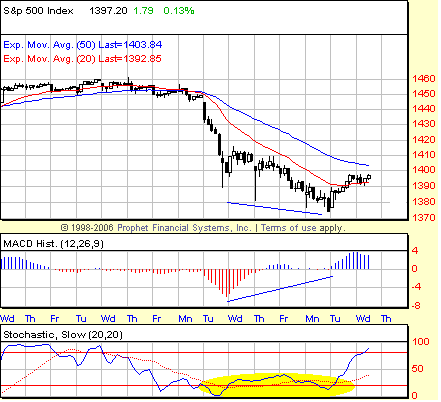
| FIGURE 1: STANDARD & POOR’S 500, HOURLY. Negative divergences in the moving average convergence/divergence (MACD) histogram and the stochastic suggest that the S&P 500 is running out of momentum to the downside in early March. The size of the MACD histogram spike on the bounce in recent days is another sign that a significant move back to the upside is increasingly likely in the near term. |
| Graphic provided by: Prophet Financial, Inc. |
| |
| I once read a poem by Maxine Kumin titled "Our Ground Time Here Will Be Brief." While I think Kumin had more metaphysical notions in mind (she said the title came to her while waiting on the runway for her plane to take off), that phrase comes to mind as I watch the S&P 500 attempt to build a bottom between 1390 and 1370. The tools of this bottom-building are standard issue: indicator divergences and oversold readings, but the commonness of the equipment is no argument against their utility. The divergences in the moving average convergence/divergence (MACD) histogram and the stochastic are very clear-cut and the signal they are sending — that the time for shorting is over and the time for buying has drawn near — is no less apparent. See Figure 1. |

|
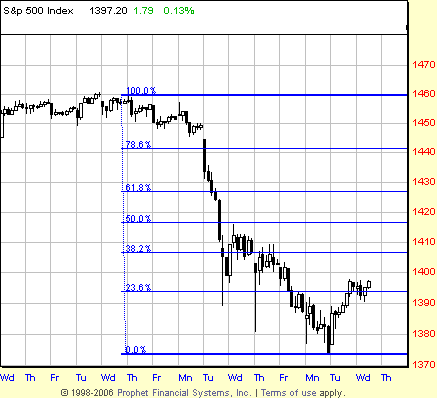
| FIGURE 2: STANDARD & POOR’S 500, HOURLY. Any bounce in the S&P 500 is likely to first meet resistance in the 1410 area, which coincides with the 38.2% Fibonacci retracement level. However, there is a dearth of resistance beyond that point, suggesting the potential for further retracement should the 38.2% barrier be breached. |
| Graphic provided by: Prophet Financial, Inc. |
| |
| What sort of upside is being suggested by the hourly charts of the S&P 500? There are two ways to gauge potential bounces. The first, most obvious, way is to look for a possible swing rule application based on the location of the nearest resistance and the current low. In this case, we find the nearest resistance level at approximately 1415 and the correction low at about 1375. Adding this difference to the value at the resistance level suggests the potential for a bounce to the 1455 level or almost a complete retracement of the correction. |
| What makes this interesting is that while there is a significant potential for resistance at the 1415 level, there is precious little resistance in the event that the S&P 500 can rally above that point (see Figure 2). In fact, I suspect there is a small battalion of bears waiting to attack any bulls that think they can drive the market through 1415. As such, any move beyond that level will likely need to attack 1415 more than once. But should any of those attacks succeed, the subsequent move higher could be too swift for all but the most nimble of traders to exploit. |
Technical Writer for Technical Analysis of STOCKS & COMMODITIES magazine, Working-Money.com, and Traders.com Advantage.
| Title: | Technical Writer |
| Company: | Technical Analysis, Inc. |
| Address: | 4757 California Avenue SW |
| Seattle, WA 98116 | |
| Phone # for sales: | 206 938 0570 |
| Fax: | 206 938 1307 |
| Website: | www.Traders.com |
| E-mail address: | DPenn@traders.com |
Traders' Resource Links | |
| Charting the Stock Market: The Wyckoff Method -- Books | |
| Working-Money.com -- Online Trading Services | |
| Traders.com Advantage -- Online Trading Services | |
| Technical Analysis of Stocks & Commodities -- Publications and Newsletters | |
| Working Money, at Working-Money.com -- Publications and Newsletters | |
| Traders.com Advantage -- Publications and Newsletters | |
| Professional Traders Starter Kit -- Software | |
Click here for more information about our publications!
Comments
Date: 03/09/07Rank: 3Comment:

Request Information From Our Sponsors
- VectorVest, Inc.
- Executive Premier Workshop
- One-Day Options Course
- OptionsPro
- Retirement Income Workshop
- Sure-Fire Trading Systems (VectorVest, Inc.)
- Trading as a Business Workshop
- VectorVest 7 EOD
- VectorVest 7 RealTime/IntraDay
- VectorVest AutoTester
- VectorVest Educational Services
- VectorVest OnLine
- VectorVest Options Analyzer
- VectorVest ProGraphics v6.0
- VectorVest ProTrader 7
- VectorVest RealTime Derby Tool
- VectorVest Simulator
- VectorVest Variator
- VectorVest Watchdog
- StockCharts.com, Inc.
- Candle Patterns
- Candlestick Charting Explained
- Intermarket Technical Analysis
- John Murphy on Chart Analysis
- John Murphy's Chart Pattern Recognition
- John Murphy's Market Message
- MurphyExplainsMarketAnalysis-Intermarket Analysis
- MurphyExplainsMarketAnalysis-Visual Analysis
- StockCharts.com
- Technical Analysis of the Financial Markets
- The Visual Investor
