HOT TOPICS LIST
- MACD
- Fibonacci
- RSI
- Gann
- ADXR
- Stochastics
- Volume
- Triangles
- Futures
- Cycles
- Volatility
- ZIGZAG
- MESA
- Retracement
- Aroon
INDICATORS LIST
LIST OF TOPICS
PRINT THIS ARTICLE
by Gary Grosschadl
Here are some very clear trading signals, including two reversal patterns.
Position: Buy
Gary Grosschadl
Independent Canadian equities trader and technical analyst based in Peterborough
Ontario, Canada.
PRINT THIS ARTICLE
REVERSAL
Classic Trading Signals On The NASDAQ Composite
03/07/07 09:12:59 AMby Gary Grosschadl
Here are some very clear trading signals, including two reversal patterns.
Position: Buy
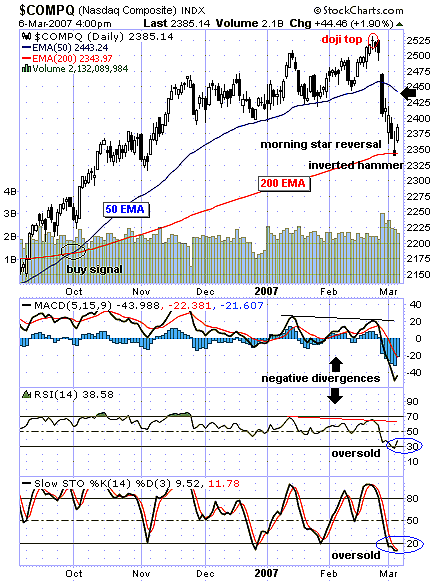
| Charts like this daily one of the NASDAQ reminds us that at times trading does not have to be difficult or complex; you just have to go with the big and obvious signals. There are no convoluted trading theories here that require mathematical formulations or chart patterns that can make your head spin. |
| Let's start with the first trading signal by way of a common moving average crossover (Figure 1). Traders often comment that when the 50-period moving average crosses over the 200-period moving average, a buy signal occurs. It may not be the earliest or timeliest signal, but it often is a safer signal that still captures a good part of the move. In this case, had the trader acted on this signal and simply stayed with the trade until the 50-day exponential moving average (EMA), a nice gain was captured. |

|
| FIGURE 1: NASDAQ COMPOSITE, DAILY. There are some great trading signals on this daily chart. |
| Graphic provided by: StockCharts.com. |
| |
| The next signal was a timely one, as it caught the very top of the move. A doji candlestick hitting a new high after a good upleg can often be an exceptional reversal signal. In this example, traders dancing close to the exit sign had two days to heed the potential topping pattern. Confirmation of the doji comes on the next trading day with a lower close. The pain of the large gap down could have been avoided without having read any market news or listening to the myriad of market pundit opinions from here or abroad. That's the big advantage technical traders often have: charts don't lie. Give me a good chart and a great cup of coffee and hold the financial press, please. |
| The next trading signal came with a bounce off the most important moving average, the 200-period exponential moving average (EMA) (although some traders prefer the simple moving average). This big moving average is often targeted by traders as significant areas of support or resistance. This bounce off the 200-day EMA came with another telling candlestick — an inverted hammer. This is a bullish bottom reversal signal with confirmation the next day. Just to drive that point home, the final pattern here is a three-day pattern called a morning star pattern. This is a major reversal pattern made up of a long black real body followed by a small-bodied candlestick that gaps lower, forming the star. The third candle is a white bullish candlestick that closes well into the first session's black real body. |
| Several indicators are examined. Note the negative divergences to the index climbing higher via the moving average convergence/divergence (MACD) and the relative strength index (RSI). The RSI is kicking up from a very oversold level of 30 while the stochastic oscillator is very oversold at under 20. Going forward, the initial trading target is the 50-day EMA currently 2443. The danger going forward is that this could be a bear rally to overhead resistance. Failure there could put this index into failure mode until that moving average ceases to be a resistance level. |
Independent Canadian equities trader and technical analyst based in Peterborough
Ontario, Canada.
| Website: | www.whatsonsale.ca/financial.html |
| E-mail address: | gwg7@sympatico.ca |
Click here for more information about our publications!
Comments
Date: 03/09/07Rank: 5Comment:
Date: 03/11/07Rank: 5Comment:

Request Information From Our Sponsors
- StockCharts.com, Inc.
- Candle Patterns
- Candlestick Charting Explained
- Intermarket Technical Analysis
- John Murphy on Chart Analysis
- John Murphy's Chart Pattern Recognition
- John Murphy's Market Message
- MurphyExplainsMarketAnalysis-Intermarket Analysis
- MurphyExplainsMarketAnalysis-Visual Analysis
- StockCharts.com
- Technical Analysis of the Financial Markets
- The Visual Investor
- VectorVest, Inc.
- Executive Premier Workshop
- One-Day Options Course
- OptionsPro
- Retirement Income Workshop
- Sure-Fire Trading Systems (VectorVest, Inc.)
- Trading as a Business Workshop
- VectorVest 7 EOD
- VectorVest 7 RealTime/IntraDay
- VectorVest AutoTester
- VectorVest Educational Services
- VectorVest OnLine
- VectorVest Options Analyzer
- VectorVest ProGraphics v6.0
- VectorVest ProTrader 7
- VectorVest RealTime Derby Tool
- VectorVest Simulator
- VectorVest Variator
- VectorVest Watchdog
