

HOT TOPICS LIST
- MACD
- Fibonacci
- RSI
- Gann
- ADXR
- Stochastics
- Volume
- Triangles
- Futures
- Cycles
- Volatility
- ZIGZAG
- MESA
- Retracement
- Aroon
INDICATORS LIST
LIST OF TOPICS
PRINT THIS ARTICLE
by Chaitali Mohile
After every dip MBFI has rested on the support of its moving average. How likely is it to behave at this support?
Position: N/A
Chaitali Mohile
Active trader in the Indian stock markets since 2003 and a full-time writer. Trading is largely based upon technical analysis.
PRINT THIS ARTICLE
MOVING AVERAGES
Will MB Financial Correct?
03/09/07 10:03:17 AMby Chaitali Mohile
After every dip MBFI has rested on the support of its moving average. How likely is it to behave at this support?
Position: N/A
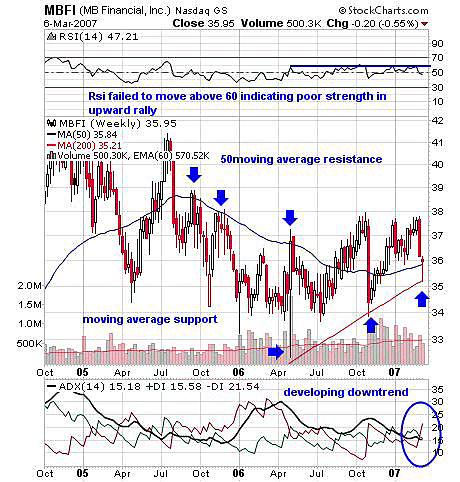
| Figure 1, the weekly chart of MBFI, shows the strength in resistance and support of the moving average. Here, the 50-day moving average and the 200-day moving average are plotted. The every new high of this stock is followed by a dip in price. The highest level of the stock is $41, with the RSI (14) near 60 in mid-July 2005. With this high made, the stock moved below 50-day moving average and settled around $36. Since then, MBFI made lower highs and lower lows. It tried to move above the 50-day moving average three times, but failed. |
|
| FIGURE 1: MBFI, WEEKLY. Here's a chart of the moving average support and resistance. |
| Graphic provided by: StockCharts.com. |
| |
| The moving average resistance is stronger and needs high-volume support. But at $32 and $34, it took the support of 200-day MA to break the resistance of 50-day MA. Again, the 200-day MA is long term and holds more strength than the 50-day MA. Twice it established support at 200-day MA and moved to $38. Due to weakness in rally, however, the stock could not move further. |
| The relative strength index (RSI)(14) didn't move above 60 in 2006. This shows a weakness in the bullish rally. The stock needs to gather more strength and increase volume to bring up the bullish strength. At the current level, the RSI has entered an uncertain level for buyers as well as for sellers. On the charts the price has formed a red doji candle, which again indicates indecision. So traders should stay cautious. The average directional movement index (ADX)(14) has declined below 20 but with increase in selling pressure. The bullish trend is surely weakened, but it also indicates that the stock may enter consolidation at the lower level. This tells traders to stay away from this stock till it gives a specific indication to move. |
|
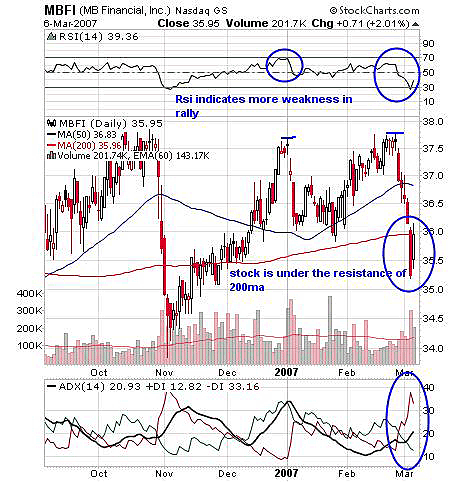
| FIGURE 2: MBFI, DAILY. Here's a chart of a new support turned resistance of 200-day moving average. |
| Graphic provided by: StockCharts.com. |
| |
| In Figure 2, traders can see a newly support-turned resistance of the moving average. Above $37.5, MBFI consolidated for a few days but failed to hold that level. As it moved below the 50-day MA more weakness poured in with the RSI (14), moving it below 50. The next support the stock had was the 200-day MA at 36. With increasing in selling pressure, the stock slipped below its moving average support. Now, this MA acts as the resistance line, restricting the upward move. The RSI (14) shows some pullback from 30. But traders should remember that no trades are possible till the moving average resistance is crossed. In addition the ADX (14) shows a developing bearish trend tailwind. |
| Hence, I would suggest that traders wait and watch the stock movement. |
Active trader in the Indian stock markets since 2003 and a full-time writer. Trading is largely based upon technical analysis.
| Company: | Independent |
| Address: | C1/3 Parth Indraprasth Towers. Vastrapur |
| Ahmedabad, Guj 380015 | |
| E-mail address: | chaitalimohile@yahoo.co.in |
Traders' Resource Links | |
| Independent has not added any product or service information to TRADERS' RESOURCE. | |
Click here for more information about our publications!
Comments
Date:�03/09/07Rank:�5Comment:�

Request Information From Our Sponsors
- StockCharts.com, Inc.
- Candle Patterns
- Candlestick Charting Explained
- Intermarket Technical Analysis
- John Murphy on Chart Analysis
- John Murphy's Chart Pattern Recognition
- John Murphy's Market Message
- MurphyExplainsMarketAnalysis-Intermarket Analysis
- MurphyExplainsMarketAnalysis-Visual Analysis
- StockCharts.com
- Technical Analysis of the Financial Markets
- The Visual Investor
- VectorVest, Inc.
- Executive Premier Workshop
- One-Day Options Course
- OptionsPro
- Retirement Income Workshop
- Sure-Fire Trading Systems (VectorVest, Inc.)
- Trading as a Business Workshop
- VectorVest 7 EOD
- VectorVest 7 RealTime/IntraDay
- VectorVest AutoTester
- VectorVest Educational Services
- VectorVest OnLine
- VectorVest Options Analyzer
- VectorVest ProGraphics v6.0
- VectorVest ProTrader 7
- VectorVest RealTime Derby Tool
- VectorVest Simulator
- VectorVest Variator
- VectorVest Watchdog