HOT TOPICS LIST
- MACD
- Fibonacci
- RSI
- Gann
- ADXR
- Stochastics
- Volume
- Triangles
- Futures
- Cycles
- Volatility
- ZIGZAG
- MESA
- Retracement
- Aroon
INDICATORS LIST
LIST OF TOPICS
PRINT THIS ARTICLE
by Chaitali Mohile
ASML has formed a bearish wedge. The new trend is about to begin.
Position: N/A
Chaitali Mohile
Active trader in the Indian stock markets since 2003 and a full-time writer. Trading is largely based upon technical analysis.
PRINT THIS ARTICLE
WEDGE FORMATIONS
ASML Could Enter Intermediate Downtrend
03/09/07 09:48:45 AMby Chaitali Mohile
ASML has formed a bearish wedge. The new trend is about to begin.
Position: N/A
| In Figure 1, a weekly chart of ASM Lithography Holding (ASML), a reversal bearish wedge has been formed. As the wedge slopes upward, diminishing volume can also be seen. The lower line of the wedge forms the support and the upper line resistance. The new trend begins when this support line is violated. The stock moved below this line at $25 and slipped down further at $23. Traders should look here for other support before taking short positions; $22 stands to be an important support as it is a previous low pivot of an upward rally. The 50-day moving average (MA) support is also 22.97, so traders can decide on a short position below this support. These short positions can be carried till the stock tests its low of 200-day MA support at $20. |

|
| FIGURE 1: ASML, WEEKLY. Here's a bearish wedge breakout. |
| Graphic provided by: StockCharts.com. |
| |
| The relative strength index (RSI)(14) has moved below 50, but this current level should still be watched. If the RSI moves down further below 40, then more weakness is likely to come. The average directional movement index (ADX)(14) has declined to 31, with an increase in negative directional index (-DI) at 22, indicating the downtrend is developing. Considering the support levels mentioned and the indicator's movement, traders can look for short positions. |
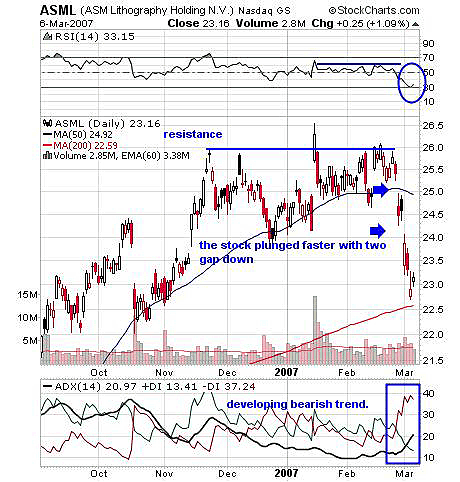
| Figure 2, the daily chart, shows high volatility in the range of $24–$26. The stock gapped down twice within this range. It seems likely the stock is topping out. The RSI (14) also moved in a very narrow range. But as price moved below the lower range, the RSI dropped steeply to 30, indicating weakness. Traders should note the 200-day moving average support at $22.50. Moving average support/resistance always plays an important role in any kind of trend. The ADX (14) has turned upward with an increase in seller pressure; -DI is 37 against +DI at 13. This indicates a bearish trend tailwind is developing. |

|
| FIGURE 2: ASML, DAILY. Here's a gap down in ASML. |
| Graphic provided by: StockCharts.com. |
| |
| ASML is setting up a temporary downtrend. The bearish wedge and gap down together indicates the end of an advance rally. |
Active trader in the Indian stock markets since 2003 and a full-time writer. Trading is largely based upon technical analysis.
| Company: | Independent |
| Address: | C1/3 Parth Indraprasth Towers. Vastrapur |
| Ahmedabad, Guj 380015 | |
| E-mail address: | chaitalimohile@yahoo.co.in |
Traders' Resource Links | |
| Independent has not added any product or service information to TRADERS' RESOURCE. | |
Click here for more information about our publications!
Comments
Date: 03/09/07Rank: 5Comment:

Request Information From Our Sponsors
- VectorVest, Inc.
- Executive Premier Workshop
- One-Day Options Course
- OptionsPro
- Retirement Income Workshop
- Sure-Fire Trading Systems (VectorVest, Inc.)
- Trading as a Business Workshop
- VectorVest 7 EOD
- VectorVest 7 RealTime/IntraDay
- VectorVest AutoTester
- VectorVest Educational Services
- VectorVest OnLine
- VectorVest Options Analyzer
- VectorVest ProGraphics v6.0
- VectorVest ProTrader 7
- VectorVest RealTime Derby Tool
- VectorVest Simulator
- VectorVest Variator
- VectorVest Watchdog
- StockCharts.com, Inc.
- Candle Patterns
- Candlestick Charting Explained
- Intermarket Technical Analysis
- John Murphy on Chart Analysis
- John Murphy's Chart Pattern Recognition
- John Murphy's Market Message
- MurphyExplainsMarketAnalysis-Intermarket Analysis
- MurphyExplainsMarketAnalysis-Visual Analysis
- StockCharts.com
- Technical Analysis of the Financial Markets
- The Visual Investor
