HOT TOPICS LIST
- MACD
- Fibonacci
- RSI
- Gann
- ADXR
- Stochastics
- Volume
- Triangles
- Futures
- Cycles
- Volatility
- ZIGZAG
- MESA
- Retracement
- Aroon
INDICATORS LIST
LIST OF TOPICS
PRINT THIS ARTICLE
by Chaitali Mohile
Texas United Bancshares is ready for a break out in a flag & pennant formation.
Position: Buy
Chaitali Mohile
Active trader in the Indian stock markets since 2003 and a full-time writer. Trading is largely based upon technical analysis.
PRINT THIS ARTICLE
FLAGS AND PENNANTS
TXUI Ready To Break Out
03/09/07 09:34:41 AMby Chaitali Mohile
Texas United Bancshares is ready for a break out in a flag & pennant formation.
Position: Buy
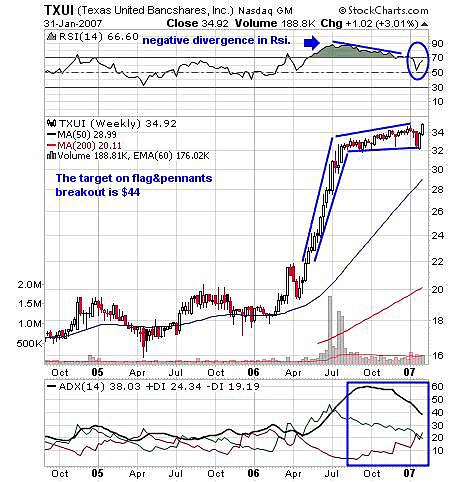
| Figure 1 shows TXUI's move from $22 to $33. The stock then consolidated for almost six months. Here the stock was moving in the range of $32 to $34, accumulating the strength for a further move. Trading during any consolidation phase is risky. Though the breakout direction is known, traders cannot identify the range-bound move. Figure 1 also shows much smaller volume during this phase. |

|
| FIGURE 1: TXUI, WEEKLY. Here's a flag & pennant breakout at $34. |
| Graphic provided by: StockCharts.com. |
| |
| As Figure 1 shows, the relative strength index (RSI) (14) was highly overbought when it made a new high of $32. The price then consolidated in a range of $32 to $34 but the RSI made lower highs. This shows negative divergence. Again, the overbought RSI needs to cool off before making a run for another rally. The negative divergence and overbought RSI together resulted in sudden dip of $2 within a range. But the RSI recovered faster, indicating the bullish strength in rally. Currently, the RSI has turned marginally overbought, opening long positions for traders. The average directional movement index (ADX)(14) has declined from the 60 to 38 level, indicating that the uptrend still exists. So traders may want to go long on this stock with the target of $44. |
| The target is calculated considering the height of the flagpole. Here, the height is $22–$32 (upward rally) — $10. So by adding $10 to the breakout level of $34, we get the target of $44. Hence, traders can buy the breakout around $34 with this target. |
| A flag & pennant breakout in an uptrend creates a low-risk buying opportunity for traders. |
Active trader in the Indian stock markets since 2003 and a full-time writer. Trading is largely based upon technical analysis.
| Company: | Independent |
| Address: | C1/3 Parth Indraprasth Towers. Vastrapur |
| Ahmedabad, Guj 380015 | |
| E-mail address: | chaitalimohile@yahoo.co.in |
Traders' Resource Links | |
| Independent has not added any product or service information to TRADERS' RESOURCE. | |
Click here for more information about our publications!
Comments
Date: 03/09/07Rank: 5Comment:

Request Information From Our Sponsors
- StockCharts.com, Inc.
- Candle Patterns
- Candlestick Charting Explained
- Intermarket Technical Analysis
- John Murphy on Chart Analysis
- John Murphy's Chart Pattern Recognition
- John Murphy's Market Message
- MurphyExplainsMarketAnalysis-Intermarket Analysis
- MurphyExplainsMarketAnalysis-Visual Analysis
- StockCharts.com
- Technical Analysis of the Financial Markets
- The Visual Investor
- VectorVest, Inc.
- Executive Premier Workshop
- One-Day Options Course
- OptionsPro
- Retirement Income Workshop
- Sure-Fire Trading Systems (VectorVest, Inc.)
- Trading as a Business Workshop
- VectorVest 7 EOD
- VectorVest 7 RealTime/IntraDay
- VectorVest AutoTester
- VectorVest Educational Services
- VectorVest OnLine
- VectorVest Options Analyzer
- VectorVest ProGraphics v6.0
- VectorVest ProTrader 7
- VectorVest RealTime Derby Tool
- VectorVest Simulator
- VectorVest Variator
- VectorVest Watchdog
