HOT TOPICS LIST
- MACD
- Fibonacci
- RSI
- Gann
- ADXR
- Stochastics
- Volume
- Triangles
- Futures
- Cycles
- Volatility
- ZIGZAG
- MESA
- Retracement
- Aroon
INDICATORS LIST
LIST OF TOPICS
PRINT THIS ARTICLE
by David Penn
One of the most straightforward ways to anticipate targets after breakouts and breakdowns helped Swiss franc traders exit profitably from a turn-of-the-year advance.
Position: N/A
David Penn
Technical Writer for Technical Analysis of STOCKS & COMMODITIES magazine, Working-Money.com, and Traders.com Advantage.
PRINT THIS ARTICLE
CURRENCY TRADING
Measured Moves In The Swiss Franc
03/07/07 08:19:00 AMby David Penn
One of the most straightforward ways to anticipate targets after breakouts and breakdowns helped Swiss franc traders exit profitably from a turn-of-the-year advance.
Position: N/A
| Measured moves and a technique that Stan Weinstein calls the "swing rule" are perhaps two of the fundamental techniques in technical analysis. Although measured moves tend to be continuation patterns when they occur in trends while the "swing rule" is generally employed at potential turning points in the market, both chartist techniques reflect a common conviction: past price action can be directly suggestive of future price action. |
| As Thomas Bulkowski writes of measured moves in the second edition of his book, Encyclopedia Of Chart Patterns: "The measured move ... or swing measurement as it is sometimes called, is an exciting formation because it vividly tells how far ... price is going." Next to the simplicity of spotting such patterns, this is truly what makes both measured moves and swing rules so valuable. Measured moves (both downward and upward) often begin with new highs or lows, and the price action is often swift, with few if any corrections along the way. The move then develops a consolidation. This consolidation, as Bulkowski reminds us, will be either horizontal or mildly directional (rising or falling to retrace a fraction of the previous move), but should not rise or fall so much as to test the previous high or low. |
| The key measurement to take in the measured move pattern is the distance from the beginning of the move (the low or the high) to the top (in the case of a potential measured move up) or the bottom (in the case of a potential measured move down) of that consolidation. This value can then be added to the bottom (in the case of a potential measured move up) or the top (in the case of a potential measured move down) to project a minimum projection for the resumption of the rally or decline. |

|
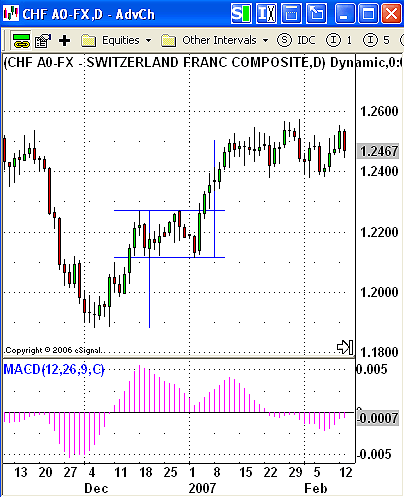
| FIGURE 1: US DOLLAR/SWISS FRANC (USD/CHF), DAILY. The rally from the early December lows to the top of the mid-December/early January consolidation is similar in size to the rally from the bottom of that consolidation to the closing high of the rally in January. |
| Graphic provided by: eSignal. |
| |
| The case of the Swiss franc (or, more accurately, the dollar/Swiss franc currency pair) is an excellent example of the measured move at work (Figure 1). The USD/CHF bottomed in early December 2006 near 1.1880. The pair rallied into the end of the month, but much of that rally (the second half of the month) was mostly an upswing in a consolidation. The upper boundary of this consolidation was at approximately 1.2272. This created an initial move of 392 points. If we add 392 to the value at the bottom of the consolidation that is, 1.2113), then we get a minimum upside projection of 1.2505. |
| Starting on January 3 — the first day of any price action, intraday or otherwise, beyond the upper boundary of the consolidation — the USD/CHF moved up in six of the seven following sessions, making an intraday high of 1.2507 on January 11. The USD/CHF shortly thereafter fell into another consolidation pattern (the first close above 1.2505 did not occur until January 26). |
Technical Writer for Technical Analysis of STOCKS & COMMODITIES magazine, Working-Money.com, and Traders.com Advantage.
| Title: | Technical Writer |
| Company: | Technical Analysis, Inc. |
| Address: | 4757 California Avenue SW |
| Seattle, WA 98116 | |
| Phone # for sales: | 206 938 0570 |
| Fax: | 206 938 1307 |
| Website: | www.Traders.com |
| E-mail address: | DPenn@traders.com |
Traders' Resource Links | |
| Charting the Stock Market: The Wyckoff Method -- Books | |
| Working-Money.com -- Online Trading Services | |
| Traders.com Advantage -- Online Trading Services | |
| Technical Analysis of Stocks & Commodities -- Publications and Newsletters | |
| Working Money, at Working-Money.com -- Publications and Newsletters | |
| Traders.com Advantage -- Publications and Newsletters | |
| Professional Traders Starter Kit -- Software | |
Click here for more information about our publications!
Comments
Date: 03/09/07Rank: 3Comment:

Request Information From Our Sponsors
- StockCharts.com, Inc.
- Candle Patterns
- Candlestick Charting Explained
- Intermarket Technical Analysis
- John Murphy on Chart Analysis
- John Murphy's Chart Pattern Recognition
- John Murphy's Market Message
- MurphyExplainsMarketAnalysis-Intermarket Analysis
- MurphyExplainsMarketAnalysis-Visual Analysis
- StockCharts.com
- Technical Analysis of the Financial Markets
- The Visual Investor
- VectorVest, Inc.
- Executive Premier Workshop
- One-Day Options Course
- OptionsPro
- Retirement Income Workshop
- Sure-Fire Trading Systems (VectorVest, Inc.)
- Trading as a Business Workshop
- VectorVest 7 EOD
- VectorVest 7 RealTime/IntraDay
- VectorVest AutoTester
- VectorVest Educational Services
- VectorVest OnLine
- VectorVest Options Analyzer
- VectorVest ProGraphics v6.0
- VectorVest ProTrader 7
- VectorVest RealTime Derby Tool
- VectorVest Simulator
- VectorVest Variator
- VectorVest Watchdog
