

HOT TOPICS LIST
- MACD
- Fibonacci
- RSI
- Gann
- ADXR
- Stochastics
- Volume
- Triangles
- Futures
- Cycles
- Volatility
- ZIGZAG
- MESA
- Retracement
- Aroon
INDICATORS LIST
LIST OF TOPICS
PRINT THIS ARTICLE
by Arthur Hill
Two gaps validate resistance for Nucor and a big double top is evolving over the last few months.
Position: Sell
Arthur Hill
Arthur Hill is currently editor of TDTrader.com, a website specializing in trading strategies, sector/industry specific breadth stats and overall technical analysis. He passed the Society of Technical Analysts (STA London) diploma exam with distinction is a Certified Financial Technician (CFTe). Prior to TD Trader, he was the Chief Technical Analyst for Stockcharts.com and the main contributor to the ChartSchool.
PRINT THIS ARTICLE
GAPS
Three Months And Three Gaps For Nucor
03/07/07 01:51:58 PMby Arthur Hill
Two gaps validate resistance for Nucor and a big double top is evolving over the last few months.
Position: Sell
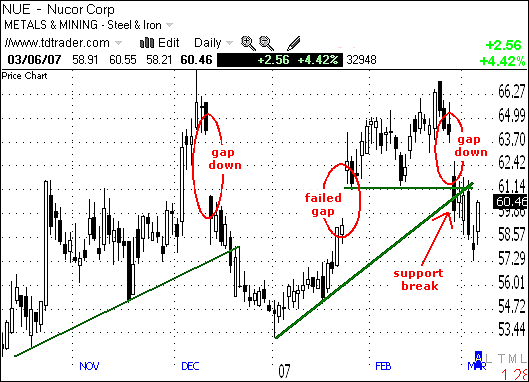
| The daily chart tells the tale of three gaps (Figure 1). There was a big gap down in December 2006, a gap up in January 2007, and a gap down at the end of February. It was a wild ride for Nucor (NUE), and the last gap sets the bearish tone. This gap and decline filled the January gap and reinforced resistance around 67. In addition, the move below 60 broke support at 61.4. The January 3rd trendline and February 9th low converged to mark support here. |
|
| FIGURE 1: NUCOR, DAILY. There were three gaps that tell a tale: a big one down in December, one up in January, and another down at the end of February. |
| Graphic provided by: Telechart 2007. |
| |
| After a sharp 10-point decline over the last two weeks, NUE has become a bit oversold and ripe for an oversold bounce. The stock firmed with a spinning top on Monday and advanced early Tuesday. The spinning top has long upper and lower shadows with a small body in the middle. This shows indecision and can sometimes foreshadow a short-term reversal. A move back toward the gap zone is possible, and I would expect resistance from this gap (~63.5). |
|
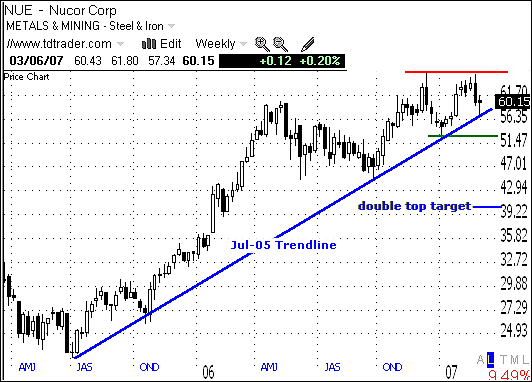
| FIGURE 2: NUCOR, WEEKLY. The two highs around 67 form a potential double top and a break below the January low would confirm this bearish reversal pattern. |
| Graphic provided by: Telechart 2007. |
| |
| Taking a step back on the weekly chart (Figure 2), the two highs around 67 form a potential double top and a break below the January low would confirm this bearish reversal pattern. The pattern extends from 53.7 to 67.55 (13-14 points) and a break below 53.7 would project further weakness to around 40 (53.7 - 13.5 = 40.2). Such a move would also mark a (Fibonacci) 62% retracement of the July 2005 to February 2007 advance. As you can see, the stock is currently finding some support from the trendline, extending up from July 2005, and a break below this trendline would be one more step toward confirming the double top. |
Arthur Hill is currently editor of TDTrader.com, a website specializing in trading strategies, sector/industry specific breadth stats and overall technical analysis. He passed the Society of Technical Analysts (STA London) diploma exam with distinction is a Certified Financial Technician (CFTe). Prior to TD Trader, he was the Chief Technical Analyst for Stockcharts.com and the main contributor to the ChartSchool.
| Title: | Editor |
| Company: | TDTrader.com |
| Address: | Willem Geetsstraat 17 |
| Mechelen, B2800 | |
| Phone # for sales: | 3215345465 |
| Website: | www.tdtrader.com |
| E-mail address: | arthurh@tdtrader.com |
Traders' Resource Links | |
| TDTrader.com has not added any product or service information to TRADERS' RESOURCE. | |
Click here for more information about our publications!
Comments
Date:�03/09/07Rank:�4Comment:�

Request Information From Our Sponsors
- StockCharts.com, Inc.
- Candle Patterns
- Candlestick Charting Explained
- Intermarket Technical Analysis
- John Murphy on Chart Analysis
- John Murphy's Chart Pattern Recognition
- John Murphy's Market Message
- MurphyExplainsMarketAnalysis-Intermarket Analysis
- MurphyExplainsMarketAnalysis-Visual Analysis
- StockCharts.com
- Technical Analysis of the Financial Markets
- The Visual Investor
- VectorVest, Inc.
- Executive Premier Workshop
- One-Day Options Course
- OptionsPro
- Retirement Income Workshop
- Sure-Fire Trading Systems (VectorVest, Inc.)
- Trading as a Business Workshop
- VectorVest 7 EOD
- VectorVest 7 RealTime/IntraDay
- VectorVest AutoTester
- VectorVest Educational Services
- VectorVest OnLine
- VectorVest Options Analyzer
- VectorVest ProGraphics v6.0
- VectorVest ProTrader 7
- VectorVest RealTime Derby Tool
- VectorVest Simulator
- VectorVest Variator
- VectorVest Watchdog