HOT TOPICS LIST
- MACD
- Fibonacci
- RSI
- Gann
- ADXR
- Stochastics
- Volume
- Triangles
- Futures
- Cycles
- Volatility
- ZIGZAG
- MESA
- Retracement
- Aroon
INDICATORS LIST
LIST OF TOPICS
PRINT THIS ARTICLE
by David Penn
A trend channel's upper boundary provides resistance to a rally transportation sector.
Position: N/A
David Penn
Technical Writer for Technical Analysis of STOCKS & COMMODITIES magazine, Working-Money.com, and Traders.com Advantage.
PRINT THIS ARTICLE
REVERSAL
Transportation's Correction Destination
03/06/07 08:46:38 AMby David Penn
A trend channel's upper boundary provides resistance to a rally transportation sector.
Position: N/A
| Often, in the gnashing of teeth that emerges as a market correction is doing its worst, people tend to forget there are often sound, technical reasons for a market to do what it will. Declines that appear on the surface to stop abruptly, or rallies that appear to terminate inexplicably without warning, often can be understood far more accurately by the market technician and his or her charts than by the conjectures of fundamentally oriented market watchers. |

|
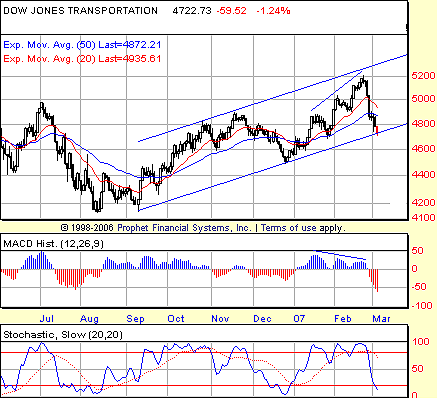
| FIGURE 1: DOW JONES TRANSPORTATION AVERAGE, DAILY. A negative divergence develops in the MACD histogram just as the DJTA rallies to test the upper boundary of a trend channel that extends back to the lows of September 2006. |
| Graphic provided by: Prophet Financial, Inc. |
| |
| Unlike the Dow industrials, the Dow transports had not just been moving higher since December 2006, but had been doing so with markedly more certainty and conviction (Figure 1). By that, I'm thinking mostly of what I referred to years ago in Working-Money as "don't look back" breakouts. These were breakouts that occurred during trends that did not retrace back into the consolidation whence they came. To picture a "don't look back" breakout, imagine a flight of stairs — or simply take a close look at the way the transports moved post-December. When the market corrected in late January and again in early February, neither of those corrections took out the previous high. |
| By contrast, the industrials featured an advance that more resembled "rolling hills" than the clear demarcation of rising stairs. While markets can advance in both fashions, a market that does not retrace back into the consolidation from which it broke free tends to reflect a market that is stronger than one that does. |
| That, of course, does not make a market immune to waning momentum, or the pent-up desires of traders to take profits. Signs of such waning momentum — if not of eager-to-take-profit traders — were growing throughout 2007. The best evidence of this might be in the MACD histogram, which was recording lower highs at the same time that the transportation average was marking higher highs. Interestingly, this was not confirmed by the stochastic, which was recording higher highs along with the transports. Perhaps this underscores the utility, when looking for divergences, of examining more than one indicator (though, unfortunately, neither indicator noted a positive divergence on the daily charts when the transports made their late December bottom). |

|
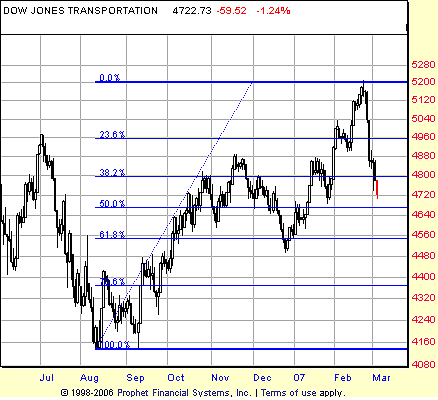
| FIGURE 2: DOW JONES TRANSPORTATION AVERAGE, DAILY. The sharp correction in the transports has brought the average close to a 50% retracement of its six-month-plus rally. While there is some price support at the 50% level, there is additional support at the 61.8% retracement level that should provide some measure of support if prices do not stop falling sooner. |
| Graphic provided by: Prophet Financial, Inc. |
| |
| How much further is the current correction in the Dow transports likely to fall? The sharpness of the correction virtually begs a bounce; from what support is that bounce most likely to come? The transports are hurtling toward a 50% retracement of the rally from the August 2006 bottom, and there are a number of old highs and old lows that are likely to contribute toward supporting the market just above or below the 4,640 level (Figure 2). If the transports do not find support at this common retracement/support level, then there is a good chance that it will find support at the next major Fibonacci retracement level, 61.8%. Here, the price support mostly comes in the form of old lows, though one of those "old lows" — the correction low from late December — is particularly pronounced and should prove especially tough support should the market reach that level. |
Technical Writer for Technical Analysis of STOCKS & COMMODITIES magazine, Working-Money.com, and Traders.com Advantage.
| Title: | Technical Writer |
| Company: | Technical Analysis, Inc. |
| Address: | 4757 California Avenue SW |
| Seattle, WA 98116 | |
| Phone # for sales: | 206 938 0570 |
| Fax: | 206 938 1307 |
| Website: | www.Traders.com |
| E-mail address: | DPenn@traders.com |
Traders' Resource Links | |
| Charting the Stock Market: The Wyckoff Method -- Books | |
| Working-Money.com -- Online Trading Services | |
| Traders.com Advantage -- Online Trading Services | |
| Technical Analysis of Stocks & Commodities -- Publications and Newsletters | |
| Working Money, at Working-Money.com -- Publications and Newsletters | |
| Traders.com Advantage -- Publications and Newsletters | |
| Professional Traders Starter Kit -- Software | |
Click here for more information about our publications!
Comments
Date: 03/06/07Rank: 3Comment:

Request Information From Our Sponsors
- StockCharts.com, Inc.
- Candle Patterns
- Candlestick Charting Explained
- Intermarket Technical Analysis
- John Murphy on Chart Analysis
- John Murphy's Chart Pattern Recognition
- John Murphy's Market Message
- MurphyExplainsMarketAnalysis-Intermarket Analysis
- MurphyExplainsMarketAnalysis-Visual Analysis
- StockCharts.com
- Technical Analysis of the Financial Markets
- The Visual Investor
- VectorVest, Inc.
- Executive Premier Workshop
- One-Day Options Course
- OptionsPro
- Retirement Income Workshop
- Sure-Fire Trading Systems (VectorVest, Inc.)
- Trading as a Business Workshop
- VectorVest 7 EOD
- VectorVest 7 RealTime/IntraDay
- VectorVest AutoTester
- VectorVest Educational Services
- VectorVest OnLine
- VectorVest Options Analyzer
- VectorVest ProGraphics v6.0
- VectorVest ProTrader 7
- VectorVest RealTime Derby Tool
- VectorVest Simulator
- VectorVest Variator
- VectorVest Watchdog
