HOT TOPICS LIST
- MACD
- Fibonacci
- RSI
- Gann
- ADXR
- Stochastics
- Volume
- Triangles
- Futures
- Cycles
- Volatility
- ZIGZAG
- MESA
- Retracement
- Aroon
INDICATORS LIST
LIST OF TOPICS
PRINT THIS ARTICLE
by David Penn
After two months of appreciation against the yen, the USD/JPY took a hard hit in February going into March.
Position: N/A
David Penn
Technical Writer for Technical Analysis of STOCKS & COMMODITIES magazine, Working-Money.com, and Traders.com Advantage.
PRINT THIS ARTICLE
CURRENCY TRADING
Negative Divergences And The USD/JPY Breakdown
03/06/07 08:23:46 AMby David Penn
After two months of appreciation against the yen, the USD/JPY took a hard hit in February going into March.
Position: N/A
| The US dollar has been in a bull market vis-a-vis the Japanese yen since the early summer of 2006. At the time, the greenback was coming off of a sizable correction that had seen the USD/JPY fall from 121.36 in December 2005 to approximately 109 in May 2006. The bull market that brought the dollar to its most recent highs against the yen saw the USD/JPY completely retraced that decline — and then some — topping 122 by January 2007. |

|
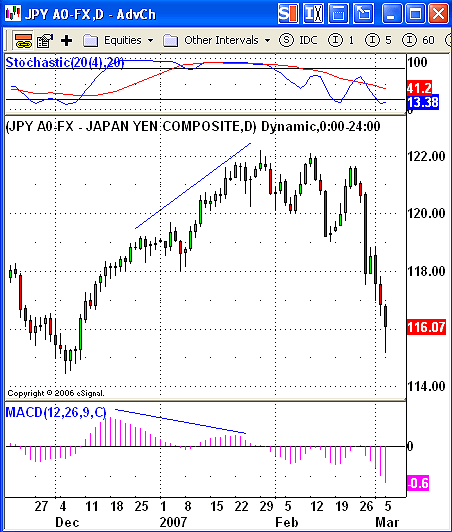
| FIGURE 1: USD/JPY, DAILY. Negative divergences in the MACD histogram and the stochastic point to a correction in the wake of the late January peak in the USD/JPY. Although it took almost a month for the USD/JPY to finally break down, note that during the movement in February, no new high was made vis-a-vis the high accompanying the negative divergence. |
| Graphic provided by: eSignal. |
| |
| There were a number of warning signs that the upside in the USD/JPY was limited. From a fundamental perspective, the concerns were over the yen carry trade. This "carry trade" involved borrowing assets with a low interest rate (such as the yen) in order to buy higher-interest rate assets (such as dollar denominated debt). "Unwinding" the carry trade means, among other things, buying back yen and potentially sending the USD/JPY into a bear market. As Figure 1 shows, this unwinding has resulted in just such a sharp move lower, one that has retraced a large amount of the USD/JPY rally since the December 2006 bottom. From the perspective of the bull market that began in May 2006, the USD/JPY has retraced nearly 50% of that advance. |
| The biggest technical warning signs, however, were the negative divergences in both the moving average convergence/divergence (MACD) histogram and the stochastic. Both indicators developed lower highs in January vis-a-vis December while USD/JPY was making higher highs. This divergence between the market price and two key technical indicators was a major signal that the rally that began at the end of the December 2006 correction (the main correction in the May 2006 to January 2007 bull market in USD/JPY) was running out of upside momentum. |

|
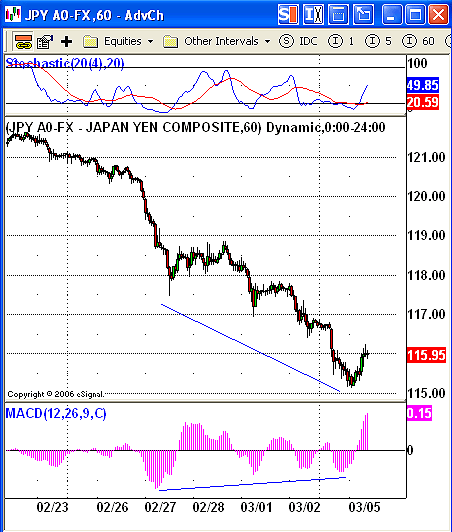
| FIGURE 2: USD/JPY, HOURLY. The low point for the MACD histogram came in late February as the price for USD/JPY continued to move lower. From that point, however, the MACD histogram troughs have become increasingly shallow as the USD/JPY has continued to fall. The size of the MACD histogram peak in early March is the first sign that these positive divergences in the MACD histogram have finally slowed USD/JPY's descent. This is the initial precondition for a bottom in the USD/JPY. |
| Graphic provided by: eSignal. |
| |
| The result of that loss of upside momentum was the wild and loose trading in most of February and the ultimate collapse in the USD/JPY in late February and into March. Interestingly, as wild and loose as the trading became, the USD/JPY never moved higher than the late January high — the high that was marked as a top by the negative divergences. |
| The collapse in USD/JPY retraced almost the entire advance from the early December 2006 bottom, and in a remarkably short period of time. As such, the USD/JPY has become particularly oversold and traders who are short USD/JPY or thinking about it should be on the lookout for a bounce. Given the sharpness of the decline — and the likelihood that the majority of traders are expecting the yen to continue to advance against the dollar (that is, continued USD/JPY weakness) — any bounce could be as sharp and sudden as the decline as traders decide to take profits from a spectacularly successful week of shorting USD/JPY. The hourly chart in Figure 2 shows one picture of the market from the perspective of a trader trying to decide whether to press the short bet or cover and move on. |
Technical Writer for Technical Analysis of STOCKS & COMMODITIES magazine, Working-Money.com, and Traders.com Advantage.
| Title: | Technical Writer |
| Company: | Technical Analysis, Inc. |
| Address: | 4757 California Avenue SW |
| Seattle, WA 98116 | |
| Phone # for sales: | 206 938 0570 |
| Fax: | 206 938 1307 |
| Website: | www.Traders.com |
| E-mail address: | DPenn@traders.com |
Traders' Resource Links | |
| Charting the Stock Market: The Wyckoff Method -- Books | |
| Working-Money.com -- Online Trading Services | |
| Traders.com Advantage -- Online Trading Services | |
| Technical Analysis of Stocks & Commodities -- Publications and Newsletters | |
| Working Money, at Working-Money.com -- Publications and Newsletters | |
| Traders.com Advantage -- Publications and Newsletters | |
| Professional Traders Starter Kit -- Software | |
Click here for more information about our publications!
Comments
Date: 03/06/07Rank: 4Comment:
Date: 03/06/07Rank: 2Comment:

Request Information From Our Sponsors
- StockCharts.com, Inc.
- Candle Patterns
- Candlestick Charting Explained
- Intermarket Technical Analysis
- John Murphy on Chart Analysis
- John Murphy's Chart Pattern Recognition
- John Murphy's Market Message
- MurphyExplainsMarketAnalysis-Intermarket Analysis
- MurphyExplainsMarketAnalysis-Visual Analysis
- StockCharts.com
- Technical Analysis of the Financial Markets
- The Visual Investor
- VectorVest, Inc.
- Executive Premier Workshop
- One-Day Options Course
- OptionsPro
- Retirement Income Workshop
- Sure-Fire Trading Systems (VectorVest, Inc.)
- Trading as a Business Workshop
- VectorVest 7 EOD
- VectorVest 7 RealTime/IntraDay
- VectorVest AutoTester
- VectorVest Educational Services
- VectorVest OnLine
- VectorVest Options Analyzer
- VectorVest ProGraphics v6.0
- VectorVest ProTrader 7
- VectorVest RealTime Derby Tool
- VectorVest Simulator
- VectorVest Variator
- VectorVest Watchdog
