HOT TOPICS LIST
- MACD
- Fibonacci
- RSI
- Gann
- ADXR
- Stochastics
- Volume
- Triangles
- Futures
- Cycles
- Volatility
- ZIGZAG
- MESA
- Retracement
- Aroon
INDICATORS LIST
LIST OF TOPICS
PRINT THIS ARTICLE
by David Penn
Negative divergences augur lower prices ahead for homebuilding stocks.
Position: N/A
David Penn
Technical Writer for Technical Analysis of STOCKS & COMMODITIES magazine, Working-Money.com, and Traders.com Advantage.
PRINT THIS ARTICLE
REVERSAL
Heavy Is The Heart Of The Homebuilders
03/02/07 12:42:22 PMby David Penn
Negative divergences augur lower prices ahead for homebuilding stocks.
Position: N/A
I last wrote about homebuilding stocks in mid-January 2007 for Traders.com Advantage ("Are Housing Stocks Rolling Over?" January 18). Although my indictment of these stocks was relatively broad, the most specific charge was leveled at Centex Corp. (CTX), which was advancing in a bearish rising wedge pattern that I thought — given the proximity of likely resistance — would result in the stock reversing to the downside. I wrote:A break of the lower of the two converging trendlines in Centex's wedge pattern would be the first true sign that the bounce that began in July 2006 had run its course and that a reversal — potentially a serious one — could be around the corner. That break did come, as shares of CTX slipped below the lower trendline a week later. Priced at the time of the article at just north of 53, Centex was most recently trading a few points above 47. |

|
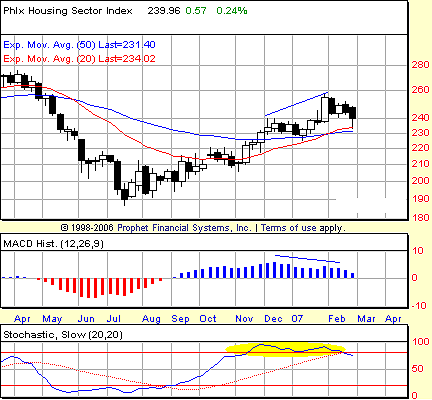
| FIGURE 1: PHILADELPHIA HOUSING SECTOR INDEX, WEEKLY. Negative divergences in the MACD histogram and the stochastic in this chart of the $HGX suggest that a top may be soon in coming for the rally that began in July 2006. |
| Graphic provided by: Prophet Financial, Inc. |
| |
| How representative are Centex's troubles? The housing sector, as measured by the Philadelphia Housing Sector Index ($HGX), has yet to break down to the same degree as Centex has. $HGX remains in an uptrend and, in addition, remains above its 20- and 50-week exponential moving averages (EMAs). At the end of January, just as Centex was slipping, the $HGX surged more than 7% higher in a single week. |
| For better or worse, however, the rally in the $HGX is starting to show the weariness that often leads to corrections, if not wholesale reversals in trend. Specifically, I'm referring to the development of negative divergences in both the moving average convergence/divergence (MACD) histogram and the stochastic between the December 2006 highs and the highs of early February 2007. |

|
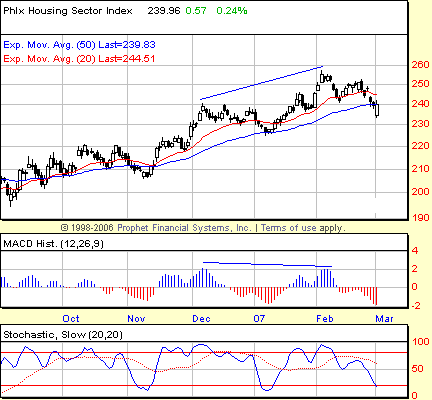
| FIGURE 2: PHILADELPHIA HOUSING SECTOR INDEX, DAILY. The same negative divergences in the MACD histogram and stochastic that appear in the weekly chart are shown here in the daily. |
| Graphic provided by: Prophet Financial, Inc. |
| |
| While the weekly chart shows a market tap-dancing on moving average support (Figure 1), the daily chart shows the same market having slipped beneath its moving averages — although most recently the $HGX has bounced back to test the resistance of the 50-day exponential moving average (in blue, above). If this bounce fails and the negative divergences shown in the MACD histogram and the stochastic prove true, then the next source of support for a falling $HGX is most likely the January correction low just south of 230. Failing that, there appears to be significant support at the 220 level, based largely on the highs of the consolidation that extends from the early autumn into late November. |
| As a group, the homebuilding stocks have enjoyed a solid advance off the summer 2006 lows, rising some 30% as measured by the $HGX. And the $HGX remains in an uptrend on a weekly basis. In the daily chart, however, a pattern of lower highs and lower lows marked February, and the most recent correction low (the last low before the most recent high) was taken out in $HGX's most recent move lower (Figure 2). If a bounce fails to materialize — and the size of the MACD trough should keep speculators skeptical of that possibility — then that pattern of lower highs and lower lows will resume, with some of the support levels mentioned soon to be challenged. |
Technical Writer for Technical Analysis of STOCKS & COMMODITIES magazine, Working-Money.com, and Traders.com Advantage.
| Title: | Technical Writer |
| Company: | Technical Analysis, Inc. |
| Address: | 4757 California Avenue SW |
| Seattle, WA 98116 | |
| Phone # for sales: | 206 938 0570 |
| Fax: | 206 938 1307 |
| Website: | www.Traders.com |
| E-mail address: | DPenn@traders.com |
Traders' Resource Links | |
| Charting the Stock Market: The Wyckoff Method -- Books | |
| Working-Money.com -- Online Trading Services | |
| Traders.com Advantage -- Online Trading Services | |
| Technical Analysis of Stocks & Commodities -- Publications and Newsletters | |
| Working Money, at Working-Money.com -- Publications and Newsletters | |
| Traders.com Advantage -- Publications and Newsletters | |
| Professional Traders Starter Kit -- Software | |
Click here for more information about our publications!
Comments
Date: 03/02/07Rank: 3Comment:

|

Request Information From Our Sponsors
- VectorVest, Inc.
- Executive Premier Workshop
- One-Day Options Course
- OptionsPro
- Retirement Income Workshop
- Sure-Fire Trading Systems (VectorVest, Inc.)
- Trading as a Business Workshop
- VectorVest 7 EOD
- VectorVest 7 RealTime/IntraDay
- VectorVest AutoTester
- VectorVest Educational Services
- VectorVest OnLine
- VectorVest Options Analyzer
- VectorVest ProGraphics v6.0
- VectorVest ProTrader 7
- VectorVest RealTime Derby Tool
- VectorVest Simulator
- VectorVest Variator
- VectorVest Watchdog
- StockCharts.com, Inc.
- Candle Patterns
- Candlestick Charting Explained
- Intermarket Technical Analysis
- John Murphy on Chart Analysis
- John Murphy's Chart Pattern Recognition
- John Murphy's Market Message
- MurphyExplainsMarketAnalysis-Intermarket Analysis
- MurphyExplainsMarketAnalysis-Visual Analysis
- StockCharts.com
- Technical Analysis of the Financial Markets
- The Visual Investor
