HOT TOPICS LIST
- MACD
- Fibonacci
- RSI
- Gann
- ADXR
- Stochastics
- Volume
- Triangles
- Futures
- Cycles
- Volatility
- ZIGZAG
- MESA
- Retracement
- Aroon
INDICATORS LIST
LIST OF TOPICS
PRINT THIS ARTICLE
by Koos van der Merwe
Alan Greenspan is no longer Federal Reserve chairman. China is a Communist country practicing capitalism. Put the two together. Do you get a perfect market storm?
Position: Sell
Koos van der Merwe
Has been a technical analyst since 1969, and has worked as a futures and options trader with First Financial Futures in Johannesburg, South Africa.
PRINT THIS ARTICLE
ELLIOTT WAVE
Is This The Perfect Market Storm?
03/02/07 09:19:57 AMby Koos van der Merwe
Alan Greenspan is no longer Federal Reserve chairman. China is a Communist country practicing capitalism. Put the two together. Do you get a perfect market storm?
Position: Sell
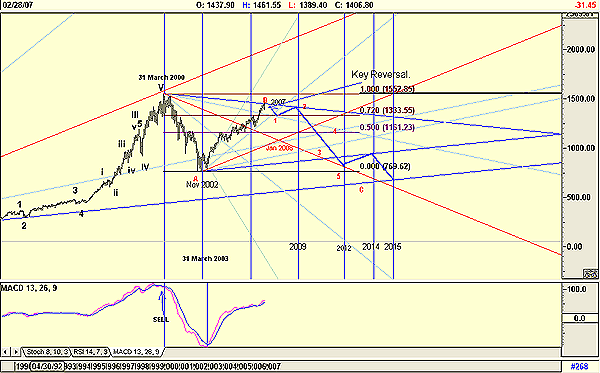
| The Standard & Poor's 500 has been suggesting that a major recession is in the offing since testing the first major resistance level, namely the 50% Fibonacci retracement level of 1161.23, as shown in Figure 1, a monthly chart with an Elliott wave count. |

|
| FIGURE 1: S&P 500, MONTHLY. This index shows the possible movement in a C-wave fall. Note the key reversal for February. |
| Graphic provided by: AdvancedGET. |
| |
| The first rule of Elliott wave theory is that it must look right. The chart does look right and is suggesting a B-wave formation is in the process, and may be topping out, as shown by the key reversal in February. A key reversal is where the high is higher than the previous high, and the low lower than the previous low, with the close in the lower 50% of the bar. This past Monday, Alan Greenspan told a Hong Kong business crowd that he sees growing signs of a US recession. The following day, there was a heady rush of investors to exit the Chinese stock market, a move that caused the worst one-day setback in the Shanghai Composite Index in a decade. Ripples of volatility spread throughout the world as the perfect storm hit every market. |
| Figure 1, which also shows Gann fans, suggests where the next turning points could be, but the resistance level appears to be the 4x1 line of the Gann fan drawn from the high of March 2000. The chart suggests that the top of the B-wave should happen in January 2008. However, allowing for a margin of error of one year, January 2007 could be the top. I have drawn in the suggested move that could occur as the index falls in a C-wave. |

|
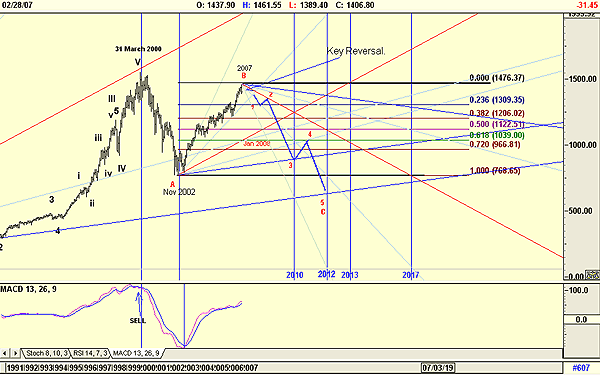
| FIGURE 2: S&P 500. The index, with Gann fans altered to take in the B-wave top. Note how the suggested dates have changed. |
| Graphic provided by: AdvancedGET. |
| |
| Figure 2 has the Gann fan drawn from the key reversal, assuming it is the high of the B-wave. This fan changes the dates for the low of wave C. I have also drawn in Fibonacci ratios as a suggestion of how the wave could fall, bottoming in 2012, at the 1X4 line of the long-term Gann fann. |
| Will all this truly happen as forecast? I do not know. I have always believed that an Elliott wave acts only as a signpost, and tells us where we are in the market. It is not a forecaster. The wave format does suggest that if indeed wave B is complete, and the index is truly falling into a C-wave, then the C-wave could be a failure, simply because the B-wave retraced too high. However, my forecast does not take this into account. It is a matter of keeping an open mind, and changing the forecast as time shows its hand. Finally, note that the indicator, a moving average convergence/divergence (MACD) (13,26,9) has not given a definite sell signal. Will the forecast truly happen? Alan Greenspan seems to think so, and so does the Chinese investor. Be careful out there. |
Has been a technical analyst since 1969, and has worked as a futures and options trader with First Financial Futures in Johannesburg, South Africa.
| Address: | 3256 West 24th Ave |
| Vancouver, BC | |
| Phone # for sales: | 6042634214 |
| E-mail address: | petroosp@gmail.com |
Click here for more information about our publications!
Comments
Date: 03/02/07Rank: 1Comment:

Request Information From Our Sponsors
- StockCharts.com, Inc.
- Candle Patterns
- Candlestick Charting Explained
- Intermarket Technical Analysis
- John Murphy on Chart Analysis
- John Murphy's Chart Pattern Recognition
- John Murphy's Market Message
- MurphyExplainsMarketAnalysis-Intermarket Analysis
- MurphyExplainsMarketAnalysis-Visual Analysis
- StockCharts.com
- Technical Analysis of the Financial Markets
- The Visual Investor
- VectorVest, Inc.
- Executive Premier Workshop
- One-Day Options Course
- OptionsPro
- Retirement Income Workshop
- Sure-Fire Trading Systems (VectorVest, Inc.)
- Trading as a Business Workshop
- VectorVest 7 EOD
- VectorVest 7 RealTime/IntraDay
- VectorVest AutoTester
- VectorVest Educational Services
- VectorVest OnLine
- VectorVest Options Analyzer
- VectorVest ProGraphics v6.0
- VectorVest ProTrader 7
- VectorVest RealTime Derby Tool
- VectorVest Simulator
- VectorVest Variator
- VectorVest Watchdog
